What is Milvus?
Milvus is a bird of prey in the genus Milvus of the hawk family Accipaitridae, celebrated for its speed in flight, keen vision, and remarkable adaptability.
Zilliz adopts the name Milvus for its open-source high-performance, highly scalable vector database that runs efficiently across a wide range of environments, from a laptop to large-scale distributed systems. It is available as both open-source software and a cloud service.
Developed by Zilliz and soon donated to the LF AI & Data Foundation under the Linux Foundation, Milvus has become one of the world’s leading open-source vector database projects. It is distributed under the Apache 2.0 license, and most contributors are experts from the high-performance computing (HPC) community, specializing in building large-scale systems and optimizing hardware-aware code. Core contributors include professionals from Zilliz, ARM, NVIDIA, AMD, Intel, Meta, IBM, Salesforce, Alibaba, and Microsoft.
Interestingly, every Zilliz open‑source project is named after a bird, which is a naming convention that symbolizes freedom, foresight, and the agile evolution of technology.
Unstructured Data, Embeddings, and Milvus
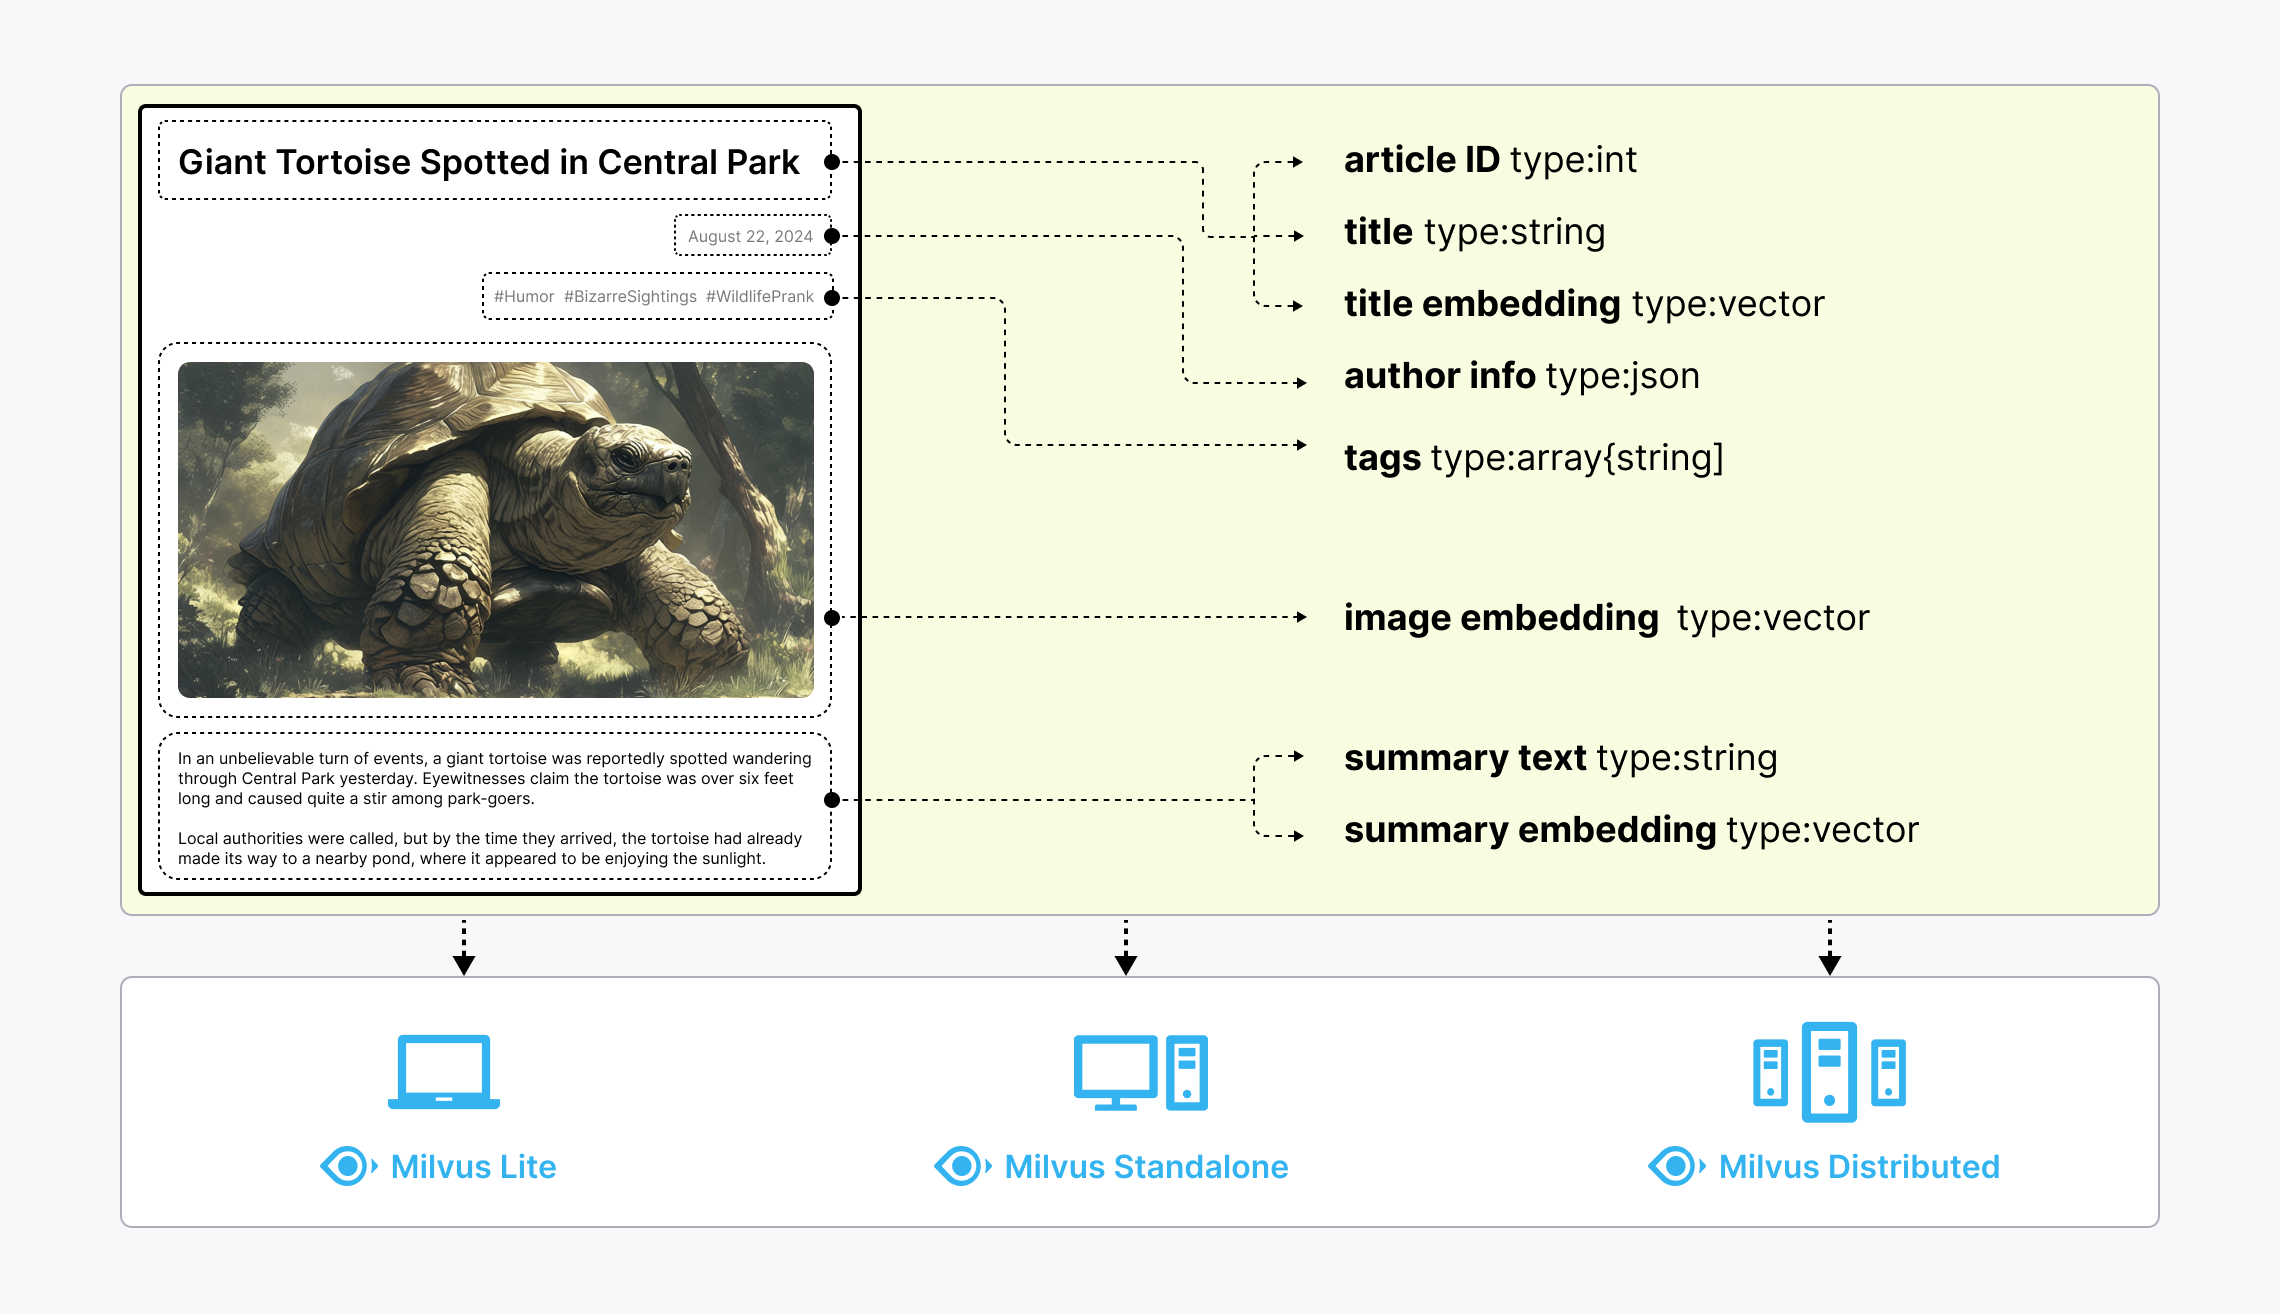
Unstructured data, such as text, images, and audio, varies in format and carries rich underlying semantics, making it challenging to analyze. To manage this complexity, embeddings are used to convert unstructured data into numerical vectors that capture its essential characteristics. These vectors are then stored in a vector database, enabling fast and scalable searches and analytics.
Milvus offers robust data modeling capabilities, enabling you to organize your unstructured or multi-modal data into structured collections. It supports a wide range of data types for different attribute modeling, including common numerical and character types, various vector types, arrays, sets, and JSON, saving you from the effort of maintaining multiple database systems.
 Untructured data, embeddings, and Milvus
Milvus offers three deployment modes, covering a wide range of data scales—from local prototyping in Jupyter Notebooks to massive Kubernetes clusters managing tens of billions of vectors:
- Milvus Lite is a Python library that can be easily integrated into your applications. As a lightweight version of Milvus, it’s ideal for quick prototyping in Jupyter Notebooks or running on edge devices with limited resources. Learn more.
- Milvus Standalone is a single-machine server deployment, with all components bundled into a single Docker image for convenient deployment. Learn more.
- Milvus Distributed can be deployed on Kubernetes clusters, featuring a cloud-native architecture designed for billion-scale or even larger scenarios. This architecture ensures redundancy in critical components. Learn more.
What Makes Milvus so Fast?
Milvus was designed from day one to be a highly efficient vector database system. In most cases, Milvus outperforms other vector databases by 2-5x (see the VectorDBBench results). This high performance is the result of several key design decisions:
Hardware-aware Optimization: To accommodate Milvus in various hardware environments, we have optimized its performance specifically for many hardware architectures and platforms, including AVX512, SIMD, GPUs, and NVMe SSD.
Advanced Search Algorithms: Milvus supports a wide range of in-memory and on-disk indexing/search algorithms, including IVF, HNSW, DiskANN, and more, all of which have been deeply optimized. Compared to popular implementations like FAISS and HNSWLib, Milvus delivers 30%-70% better performance.
Search Engine in C++: Over 80% of a vector database’s performance is determined by its search engine. Milvus uses C++ for this critical component due to the language’s high performance, low-level optimization, and efficient resource management. Most importantly, Milvus integrates numerous hardware-aware code optimizations, ranging from assembly-level vectorization to multi-thread parallelization and scheduling, to fully leverage hardware capabilities.
Column-Oriented: Milvus is a column-oriented vector database system. The primary advantages come from the data access patterns. When performing queries, a column-oriented database reads only the specific fields involved in the query, rather than entire rows, which greatly reduces the amount of data accessed. Additionally, operations on column-based data can be easily vectorized, allowing for operations to be applied in the entire columns at once, further enhancing performance.
What Makes Milvus so Scalable
In 2022, Milvus supported billion-scale vectors, and in 2023, it scaled up to tens of billions with consistent stability, powering large-scale scenarios for over 300 major enterprises, including Salesforce, PayPal, Shopee, Airbnb, eBay, NVIDIA, IBM, AT&T, LINE, ROBLOX, Inflection, etc.
Milvus’s cloud-native and highly decoupled system architecture ensures that the system can continuously expand as data grows:
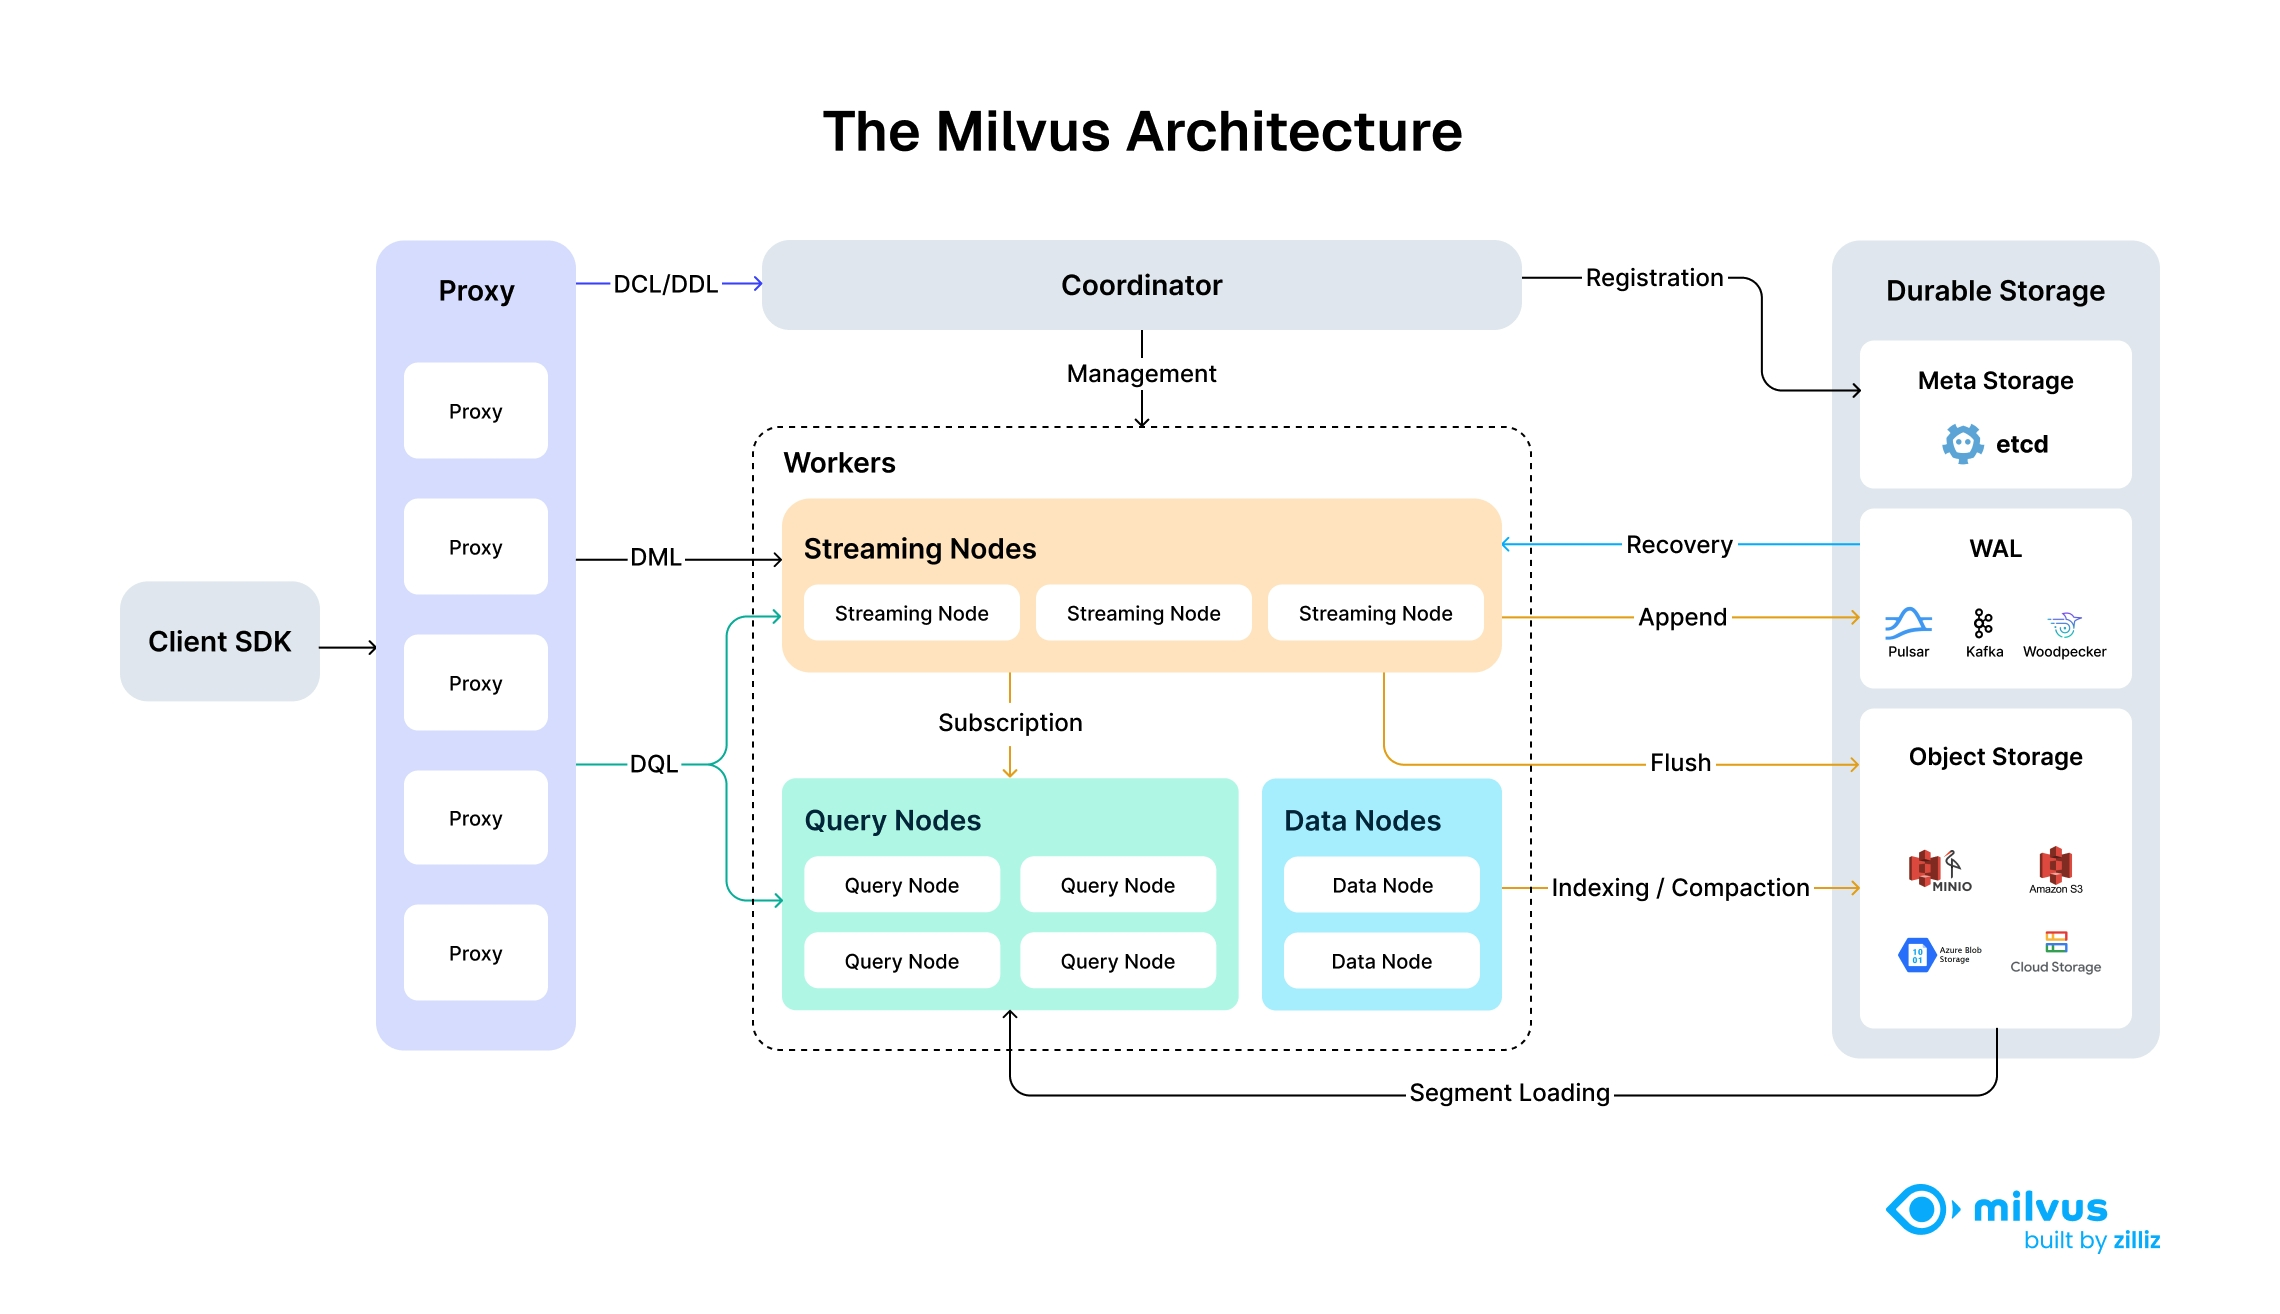 Highly decoupled system architecture of Milvus
Milvus itself is fully stateless so it can be easily scaled with the help of Kubernetes or public clouds. In addition, Milvus components are well decoupled, with the three most critical tasks—search, data insertion, and indexing/compaction—designed as easily parallelized processes, with complex logic separated out. This ensures that the corresponding query node, data node, and index node can scale both up and out independently, optimizing performance and cost efficiency.
Types of Searches Supported by Milvus
Milvus supports various types of search functions to meet the demands of different use cases:
- ANN Search: Finds the top K vectors closest to your query vector.
- Filtering Search: Performs ANN search under specified filtering conditions.
- Range Search: Finds vectors within a specified radius from your query vector.
- Hybrid Search: Conducts ANN search based on multiple vector fields.
- Full Text Search: Full text search based on BM25.
- Reranking: Adjusts the order of search results based on additional criteria or a secondary algorithm, refining the initial ANN search results.
- Fetch: Retrieves data by their primary keys.
- Query: Retrieves data using specific expressions.
Comprehensive Feature Set
In addition to the key search features mentioned above, Milvus also provides a set of features implemented around ANN searches so that you can fully utilize its capabilities.
API and SDK
- RESTful API (official)
- PyMilvus (Python SDK) (official)
- Go SDK (official)
- Java SDK (official)
- Node.js (JavaScript) SDK (official)
- C# (contributed by Microsoft)
- C++ SDK (under development)
- Rust SDK (under development)
Advanced Data Types
In addition to primitive data types, Milvus supports various advanced data types and their respective applicable distance metrics.
- Sparse Vectors
- Binary Vectors
- JSON Support
- Array Support
- Text (under development)
- Geolocation (under development)
Why Milvus?
High Performance at Scale and High Availability
Milvus features a distributed architecture that separates compute and storage. Milvus can horizontally scale and adapt to diverse traffic patterns, achieving optimal performance by independently increasing query nodes for read-heavy workload and data node for write-heavy workload. The stateless microservices on K8s allow quick recovery from failure, ensuring high availability. The support for replicas further enhances fault tolerance and throughput by loading data segments on multiple query nodes. See benchmark for performance comparison.
Support for Various Vector Index Types and Hardware Acceleration
Milvus separates the system and core vector search engine, allowing it to support all major vector index types that are optimized for different scenarios, including HNSW, IVF, FLAT (brute-force), SCANN, and DiskANN, with quantization-based variations and mmap. Milvus optimizes vector search for advanced features such as metadata filtering and range search. Additionally, Milvus implements hardware acceleration to enhance vector search performance and supports GPU indexing, such as NVIDIA’s CAGRA.
Flexible Multi-tenancy and Hot/Cold Storage
Milvus supports multi-tenancy through isolation at database, collection, partition, or partition key level. The flexible strategies allow a single cluster to handle hundreds to millions of tenants, also ensures optimized search performance and flexible access control. Milvus enhances cost-effectiveness with hot/cold storage. Frequently accessed hot data can be stored in memory or on SSDs for better performance, while less-accessed cold data is kept on slower, cost-effective storage. This mechanism can significantly reduce costs while maintaining high performance for critical tasks.
Sparse Vector for Full Text Search and Hybrid Search
In addition to semantic search through dense vector, Milvus also natively supports full text search with BM25 as well as learned sparse embedding such as SPLADE and BGE-M3. Users can store sparse vector and dense vector in the same collection, and define functions to rerank results from multiple search requests. See examples of Hybrid Search with semantic search + full text search.
Data Security and Fine-grain Access Control
Milvus ensures data security by implementing mandatory user authentication, TLS encryption, and Role-Based Access Control (RBAC). User authentication ensures that only authorized users with valid credentials can access the database, while TLS encryption secures all communications within the network. Additionally, RBAC allows for fine-grained access control by assigning specific permissions to users based on their roles. These features make Milvus a robust and secure choice for enterprise applications, protecting sensitive data from unauthorized access and potential breaches.
AI Integrations
Embedding Model Integrations Embedding Models convert unstructured data to their numeric representation in high-dimensional data space so that you can store them in Milvus. Currently, PyMilvus, the Python SDK, integrates several embedding models so that you can quickly prepare your data into vector embeddings. For details, see Embedding Overview.
Reranking Model Integrations In the realm of information retrieval and generative AI, a reranker is an essential tool that optimizes the order of results from initial searches. PyMilvus also integrates several reranking models to optimize the order of results returned from initial searches. For details, refer to Rerankers Overview.
LangChain and other AI Tool Integrations In the GenAI era, tools, such as LangChain, gain much attentions from application developers. As a core component, Milvus usually serves as the vector stores in such tools. To learn how to integrate Milvus in your favorite AI tools, refer to our Integrations and Tutorials.
Tools and Ecosystem
Attu Attu is an all-in-one intuitive GUI that helps you manage Milvus and the data it stores. For details, refer to the Attu repository.
Birdwatcher Birdwatcher is a debugging tool for Milvus. Using it to connect to etcd, you can check the state of your Milvus system or configure it on the fly. For details, refer to BirdWatcher.
Promethus & Grafana integrations Prometheus is an open-source system monitoring and alerting toolkit for Kubernetes. Grafana is an open-source visualizing stack that can connect with all data sources. You can use Promethus & Grafana as the monitoring service provider to visually monitor the performance of Milvus distributed. For details, see Deploying Monitoring Services.
Milvus Backup Milvus Backup is a tool that allows users to back up and restore Milvus data. It provides both CLI and API to fit itself into different application scenarios. For details, refer to Milvus Backup.
Milvus Capture Data Change (CDC) Milvus-CDC can capture and synchronize incremental data in Milvus instances and ensures the reliability of business data by seamlessly transferring it between source and target instances, allowing for easy incremental backup and disaster recovery. For details, refer to Milvus CDC.
Milvus Connectors Milvus has planned a set of connectors for you to seamlessly integrate Milvus with third-party tools, such as Apache Spark. Currently, you can use our Spark Connector to feed your Milvus data to Apache Spark for machine-learning processing. For details, refer to Spark-Milvus Connector.
Vector Transmission Services (VTS) Milvus provides a set of tools for you to transfer your data between a Milvus instance and a bunch of data sources, including Zilliz clusters, Elasticsearch, Postgres (PgVector), and another Milvus instance. For details, refer to VTS.