Using the Milvus Vector Database for Real-Time Query
 Cover image
This article is written by Xi Ge and transcreated by Angela Ni.
In the previous post, we have talked about data insertion and data persistence in Milvus. In this article, we will continue to explain how different components in Milvus interact with each other to complete real-time data query.
Some useful resources before getting started are listed below. We recommend reading them first to better understand the topic in this post.
- Deep dive into the Milvus architecture
- Milvus data model
- The role and function of each Milvus component
- Data processing in Milvus
- Data insertion and data persistence in Milvus
Load data to query node
Before a query is executed, the data has to be loaded to the query nodes first.
There are two types of data that are loaded to query node: streaming data from log broker, and historical data from object storage (also called persistent storage below).
 Flowchart
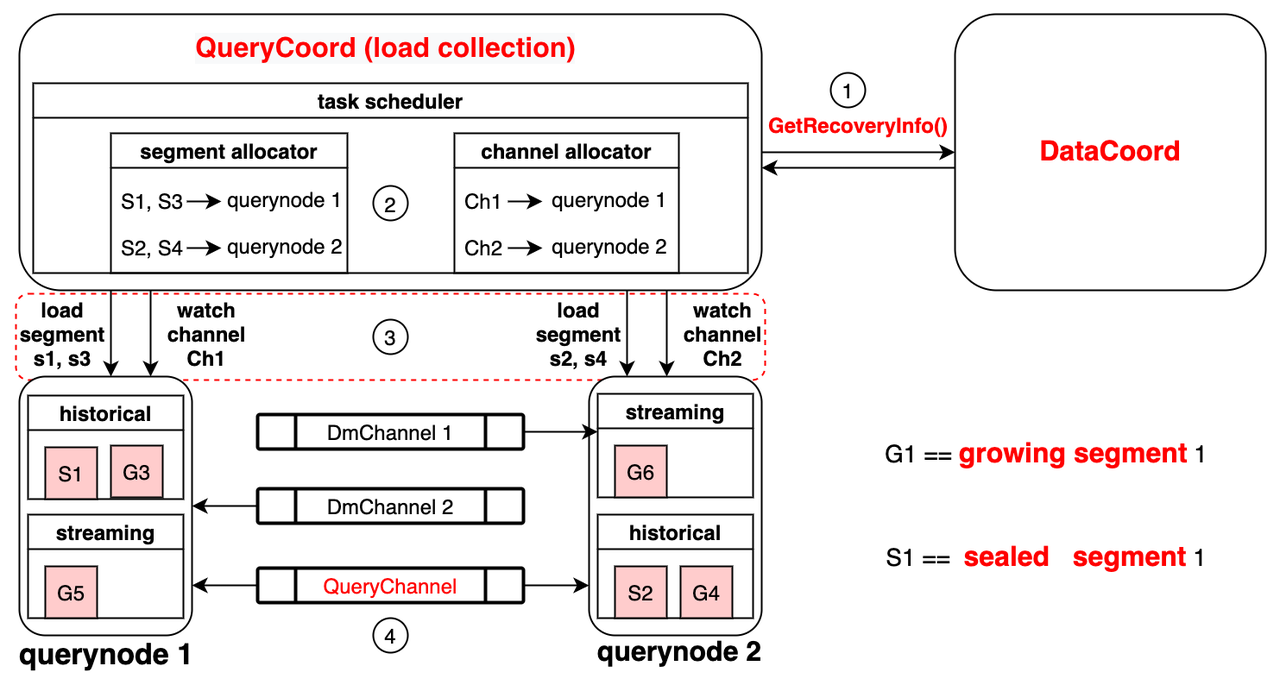
Data coord is in charge of handling streaming data that are continuously inserted into Milvus. When a Milvus user calls collection.load() to load a collection, query coord will inquire the data coord to learn which segments have been persisted in storage and their corresponding checkpoints. A checkpoint is a mark to signify that persisted segments before the checkpoints are consumed while those after the checkpoint are not.
Then, the query coord outputs allocation strategy based on the information from the data coord: either by segment or by channel. The segment allocator is responsible for allocating segments in persistent storage (batch data) to different query nodes. For instance, in the image above, the segment allocator allocates segment 1 and 3 (S1, S3) to query node 1, and segment 2 and 4 (S2, S4) to query node 2. The channel allocator assigns different query nodes to watch multiple data manipulation channels (DMChannels) in the log broker. For instance, in the image above, the channel allocator assigns query node 1 to watch channel 1 (Ch1), and query node 2 to watch channel 2 (Ch2).
With the allocation strategy, each query node loads segment data and watch the channels accordingly. In query node 1 in the image, historical data (batch data), are loaded via the allocated S1 and S3 from persistent storage. In the meanwhile, query node 1 loads incremental data (streaming data) by subscribing to channel 1 in log broker.
Data management in query node
A query node needs to manage both historical and incremental data. Historical data are stored in sealed segments while incremental data are stored in growing segments.
Historical data management
There are mainly two considerations for historical data management: load balance and query node failover.
 Load balance
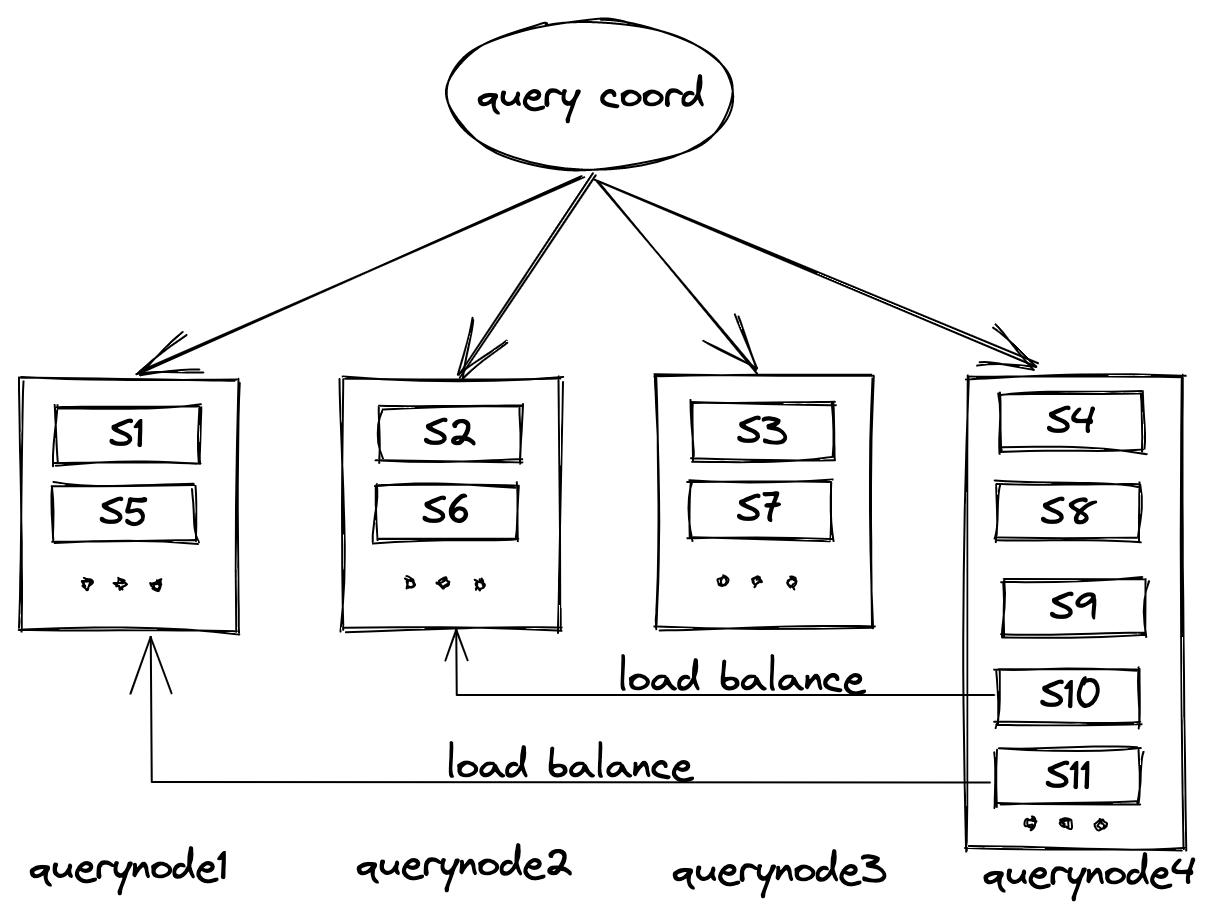
For instance, as shown in the illustration, query node 4 has been allocated more sealed segments than the rest of the query nodes. Very likely, this will make query node 4 the bottleneck that slows down the whole query process. To solve this issue, the system needs to allocate several segments in query node 4 to other query nodes. This is called load balance.
 Query node failover
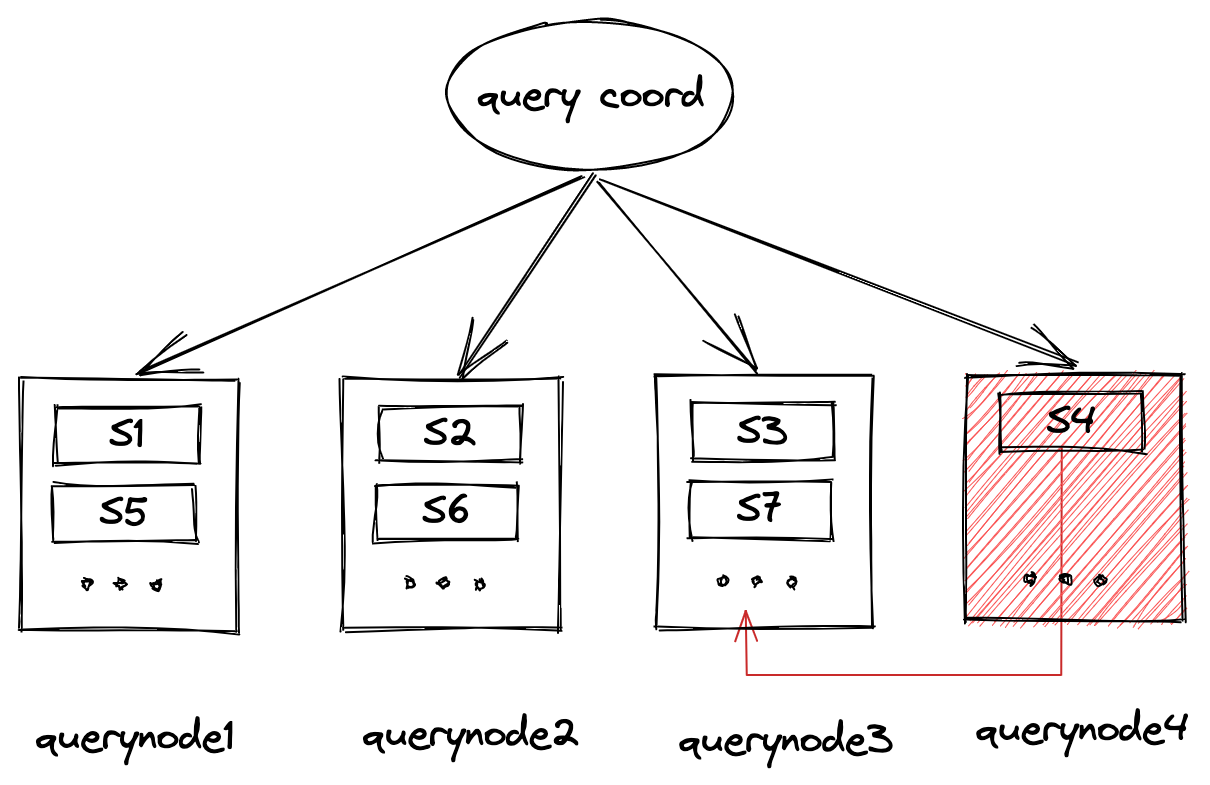
Another possible situation is illustrated in the image above. One of the nodes, query node 4, is suddenly down. In this case, the load (segments allocated to query node 4) needs to be transferred to other working query nodes to ensure the accuracy of query results.
Incremental data management
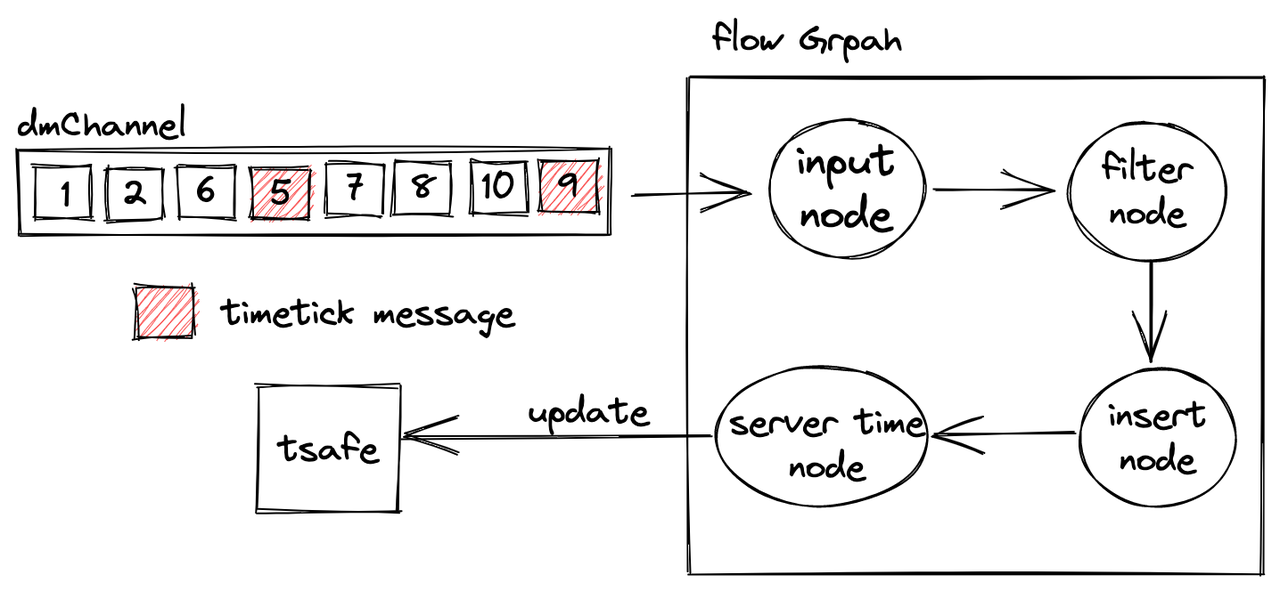
Query node watches DMChannels to receive incremental data. Flowgraph is introduced in this process. It first filters all the data insertion messages. This is to ensure that only data in a specified partition is loaded. Each collection in Milvus has a corresponding channel, which is shared by all partitions in that collection. Therefore, a flowgraph is needed for filtering inserted data if a Milvus user only needs to load data in a certain partition. Otherwise, data in all partitions in the collection will be loaded to query node.
After being filtered, the incremental data are inserted into growing segments, and further passed on to server time nodes.
 Flowgraph
During data insertion, each insertion message is assigned a timestamp. In the DMChannel shown in the image above, data are are inserted in order, from left to right. The timestamp for the first insertion message is 1; the second, 2; and the third, 6. The fourth message marked in red is not an insertion message, but rather a timetick message. This is to signify that inserted data whose timestamps are smaller than this timetick are already in log broker. In other words, data inserted after this timetick message should all have timestamps whose values are bigger than this timetick. For instance, in the image above, when query node perceives that the current timetick is 5, it means all insertion messages whose timestamp value is less than 5 are all loaded to query node.
The server time node provides an updated tsafe value every time it receives a timetick from the insert node. tsafe means safety time, and all data inserted before this point of time can be queried. Take an example, if tsafe = 9, inserted data with timestamps smaller than 9 can all be queried.
Real-time query in Milvus
Real-time query in Milvus is enabled by query messages. Query messages are inserted into log broker by proxy. Then query nodes obtain query messages by watching the query channel in log broker.
Query message
 Query message
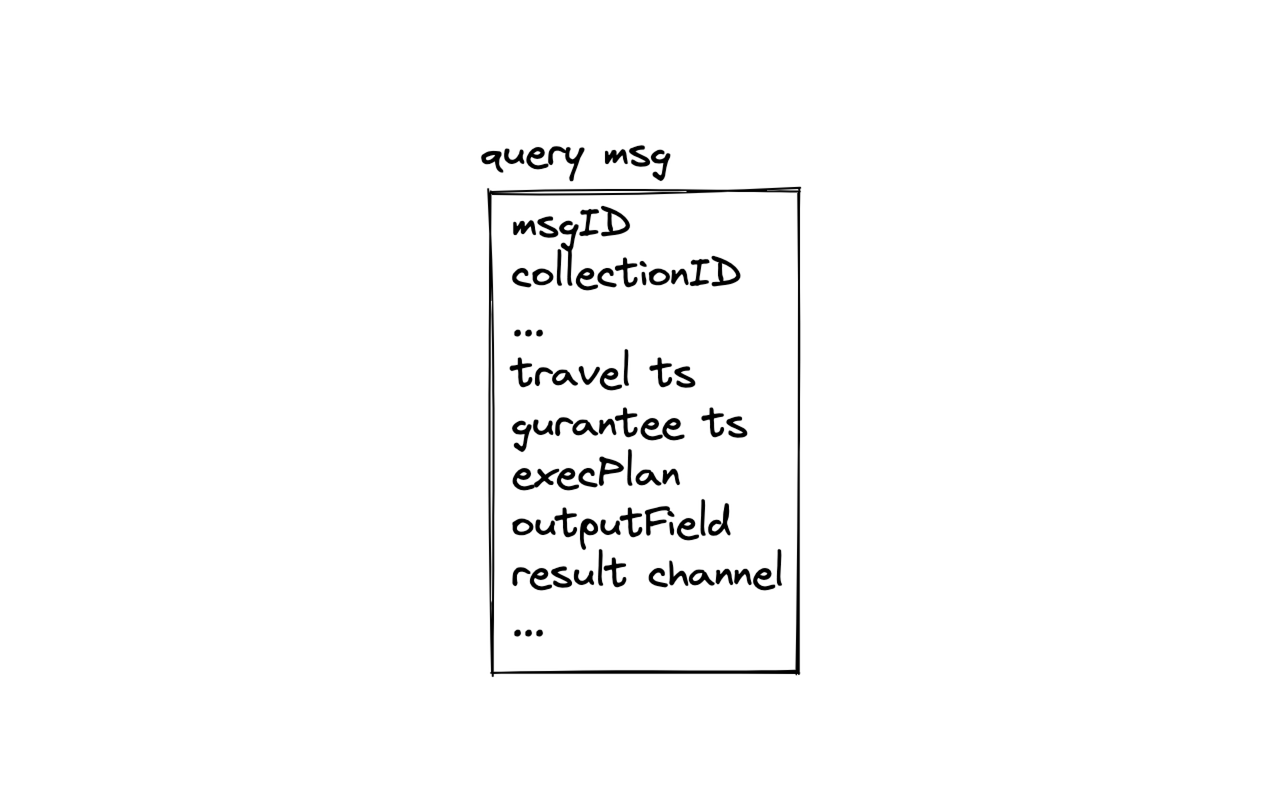
A query message includes the following crucial information about a query:
msgID: Message ID, the ID of the query message assigned by the system.collectionID: The ID of the collection to query (if specified by user).execPlan: The execution plan is mainly used for attribute filtering in a query.service_ts: Service timestamp will be updated together withtsafementioned above. Service timestamp signifies at which point is the service in. All data inserted beforeservice_tsare available for query.travel_ts: Travel timestamp specifies a range of time in the past. And the query will be conducted on data existing in the time period specified bytravel_ts.guarantee_ts: Guarantee timestamp specifies a period of time after which the query needs to be conducted. Query will only be conducted whenservice_ts>guarantee_ts.
Real-time query
 Query process
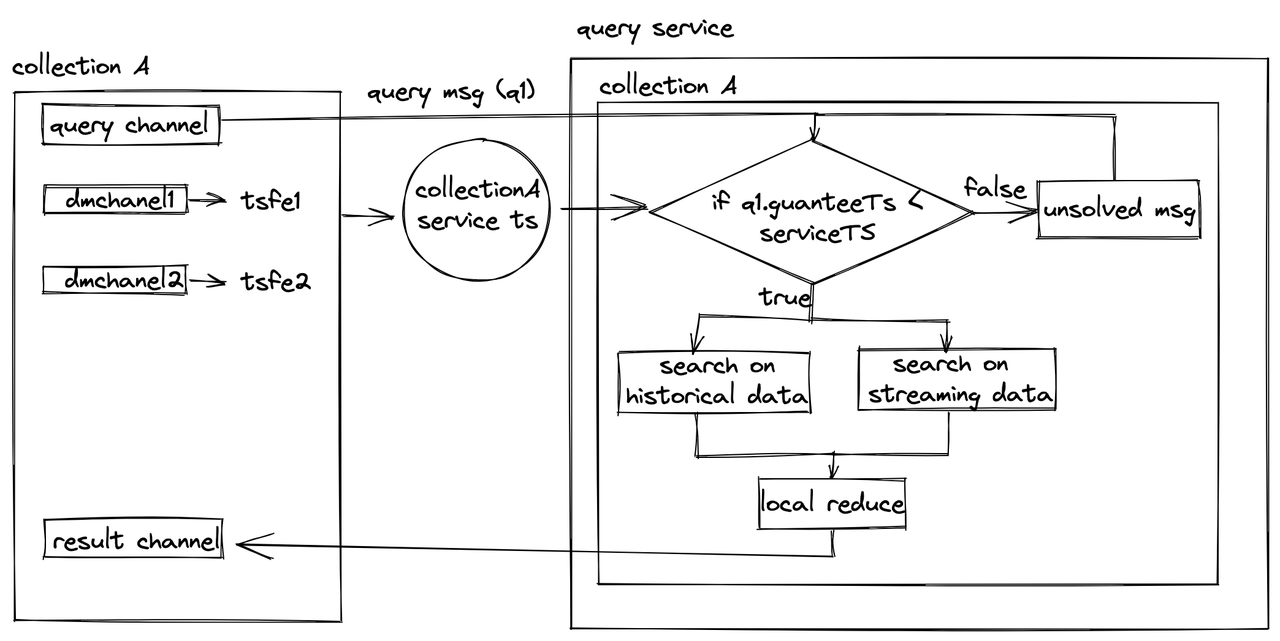
When a query message is received, Milvus first judges if the current service time, service_ts, is larger than the guarantee timestamp, guarantee_ts, in the query message. If yes, the query will be executed. Query will be conducted in parallel on both historical data and incremental data. Since there can be an overlap of data between streaming data and batch data , an action called “local reduce” is needed to filter out the redundant query results.
However, if the current service time is smaller than the guarantee timestamp in a newly inserted query message, the query message will become an unsolved message and wait to be processed till the service time becomes bigger than the guarantee timestamp.
Query results are ultimately pushed to the result channel. Proxy obtains the query results from that channel. Likewise, proxy will conduct a “global reduce” as well because it receives results from multiple query nodes and query results might be repetitive.
To ensure that the proxy has received all query results before returning them to the SDK, result message will also keep a record of information including searched sealed segments, searched DMChannels, and global sealed segments (all segments on all query nodes). The system can conclude that the proxy has received all query results only if both of the following conditions are met:
- The union of all searched sealed segments recorded in all result messages is larger than global sealed segments,
- All DMChannels in the collection are queried.
Ultimately, proxy returns the final results after “global reduce” to the Milvus SDK.
About the Deep Dive Series
With the official announcement of general availability of Milvus 2.0, we orchestrated this Milvus Deep Dive blog series to provide an in-depth interpretation of the Milvus architecture and source code. Topics covered in this blog series include:
- Load data to query node
- Data management in query node
- Real-time query in Milvus
- About the Deep Dive Series
On This Page
Try Managed Milvus for Free
Zilliz Cloud is hassle-free, powered by Milvus and 10x faster.
Get StartedLike the article? Spread the word