Visualize Milvus Metrics in Grafana
This topic describes how to visualize Milvus metrics using Grafana.
As described in the monitoring guide, metrics contain useful information such as how much memory is used by a specific Milvus component. Monitoring metrics helps you better understand Milvus performance and its running status so that you can adjust resource allocation timely.
Visualization is a chart showing the change of resource usage across time, which makes it easier for you to quickly see and notice the changes to resource usage especially when an event occurs.
This tutorial uses Grafana, an open-source platform for time-series analytics, to visualize various performance metrics of a Milvus cluster deployed on Kubernetes (K8s).
Prerequisites
- You have installed a Milvus cluster on K8s).
- You need to configure Prometheus to monitor and collect metrics before using Grafana to visualize the metrics. If the setup is successful, you can access Grafana at
http://localhost:3000. Or you can also access Grafana using the default Grafanauser:passwordofadmin:admin.
Visualize metrics using Grafana
1. Download and import dashboard
Download and import Milvus dashboard from the JSON file.
wget https://raw.githubusercontent.com/milvus-io/milvus/refs/heads/master/deployments/monitor/grafana/milvus-dashboard.json
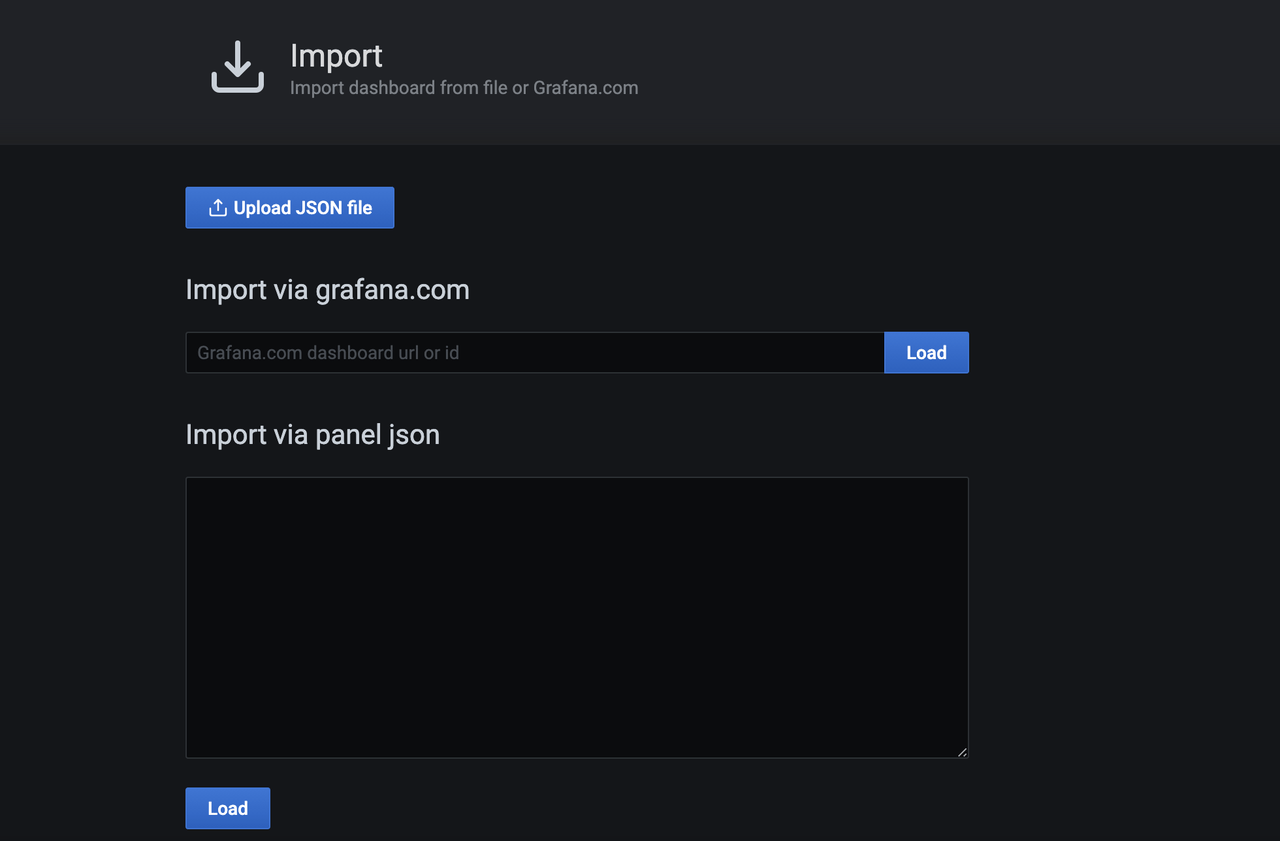 Download_and_import
2. View metrics
Select the Milvus instance you want to monitor. Then you can see the Milvus components panel.
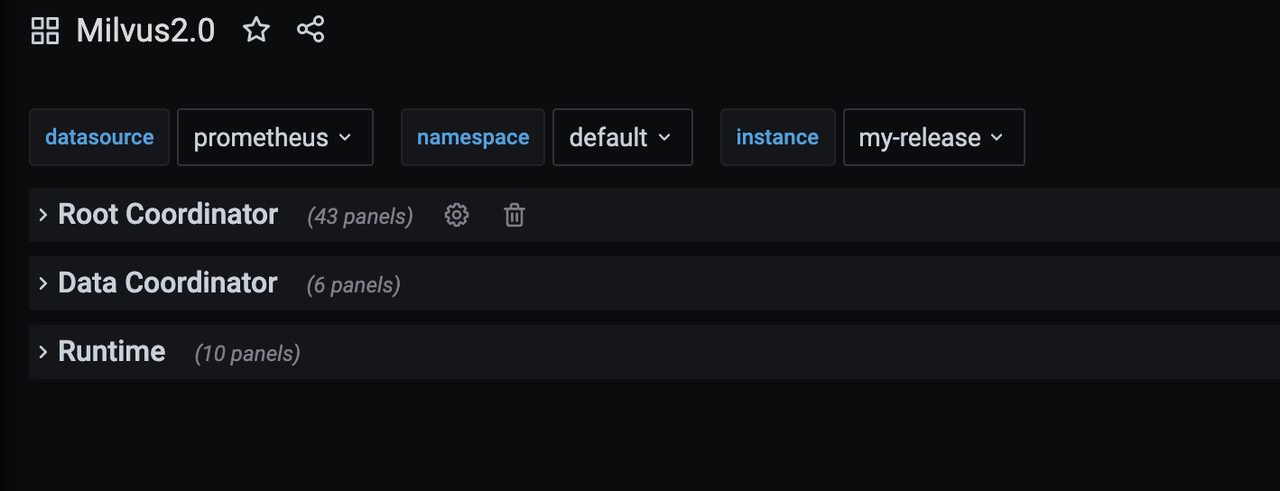 Select_instance
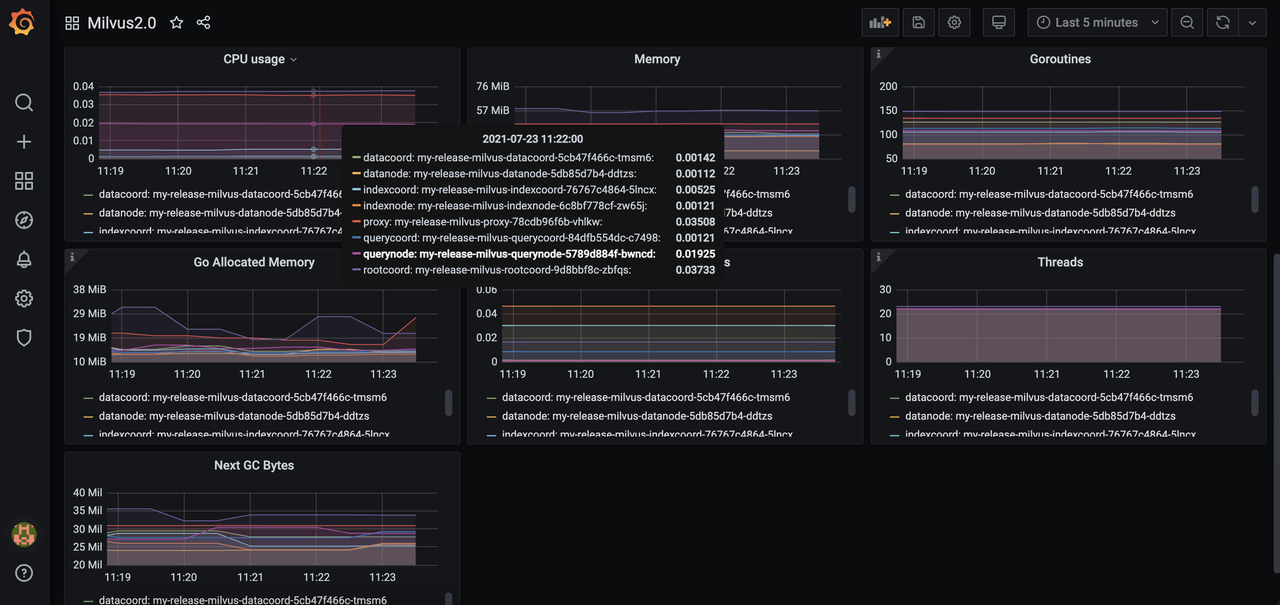 Grafana_panel
What’s next
- If you have set Grafana to visualize Milvus metrics, you might also want to:
- Learn how to create an alert for Milvus services
- Adjust your resource allocation
- Scale out or scale in a Milvus cluster
- If you are interested in upgrading the Milvus version,