How to Debug Slow Search Requests in Milvus
Performance is at the heart of Milvus. Under normal conditions, a search request within Milvus completes in just milliseconds. But what happens when your cluster slows down—when search latency stretches into whole seconds instead?
Slow searches don’t happen often, but they can surface at scale or under complex workloads. And when they do, they matter: they disrupt user experience, skew application performance, and often expose hidden inefficiencies in your setup.
In this post, we’ll walk through how to triage slow requests in Milvus and share practical steps you can take to keep latency predictable, stable, and consistently low.
Identifying Slow Searches
Diagnosing a slow request starts with two questions: how often does it happen, and where is the time going? Milvus gives you both answers through metrics and logs.
Milvus Metrics
Milvus exports detailed metrics you can monitor in Grafana dashboards.
Key panels include:
Service Quality → Slow Query: Flags any request exceeding proxy.slowQuerySpanInSeconds (default: 5s). These are also marked in Prometheus.
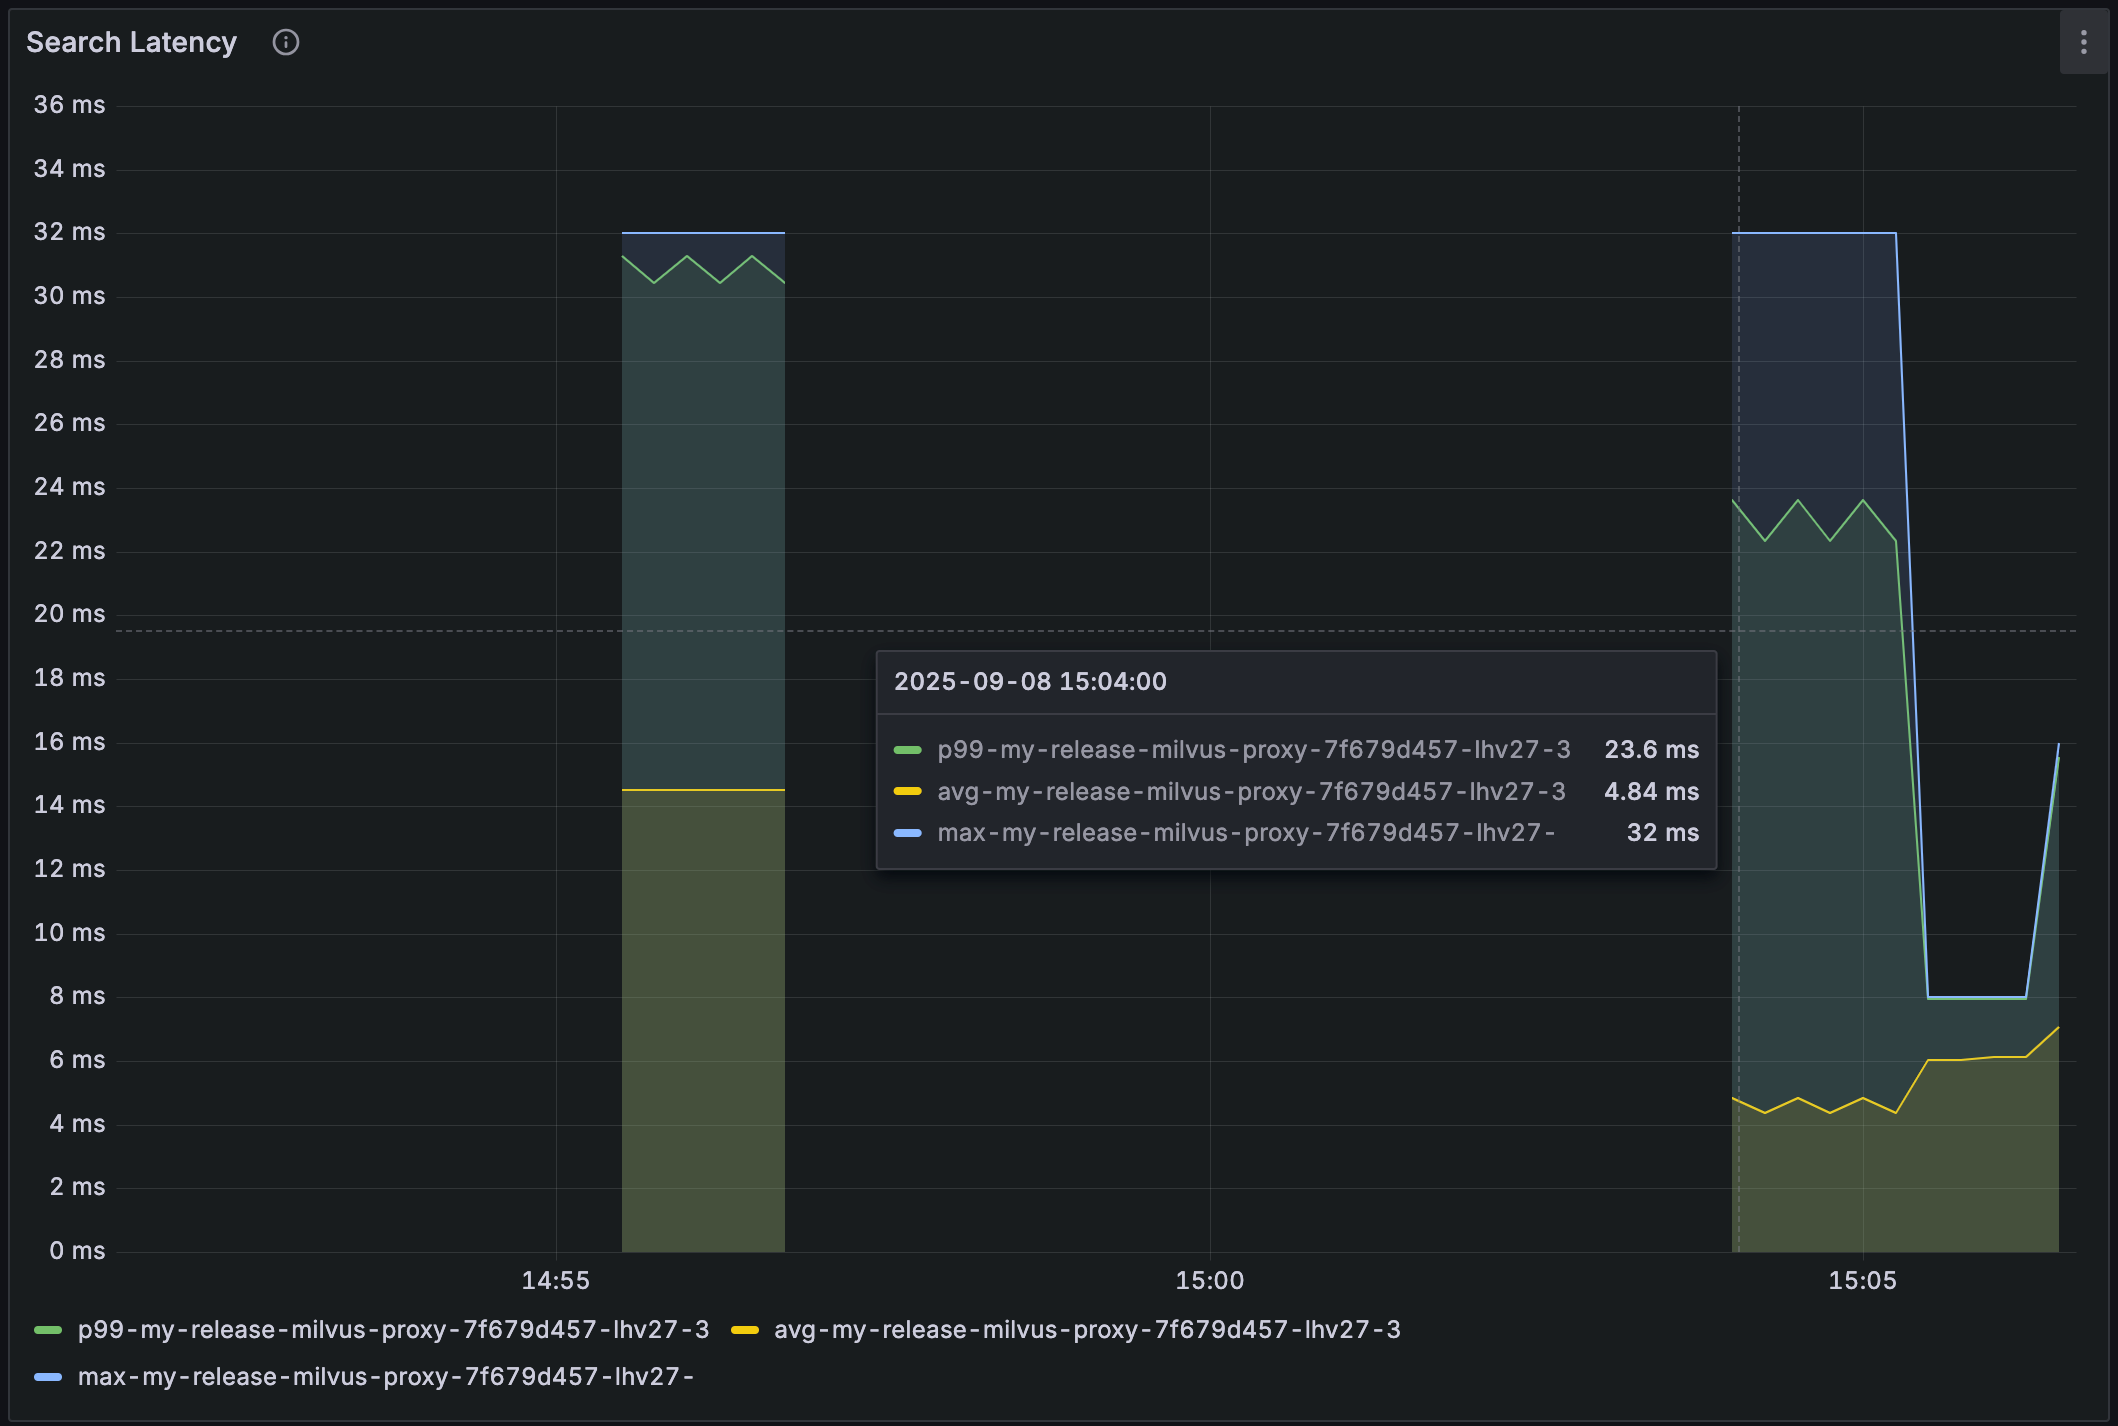
Service Quality → Search Latency: Shows overall latency distribution. If this looks normal, but end users still see delays, the problem is likely outside Milvus—in the network or application layer.
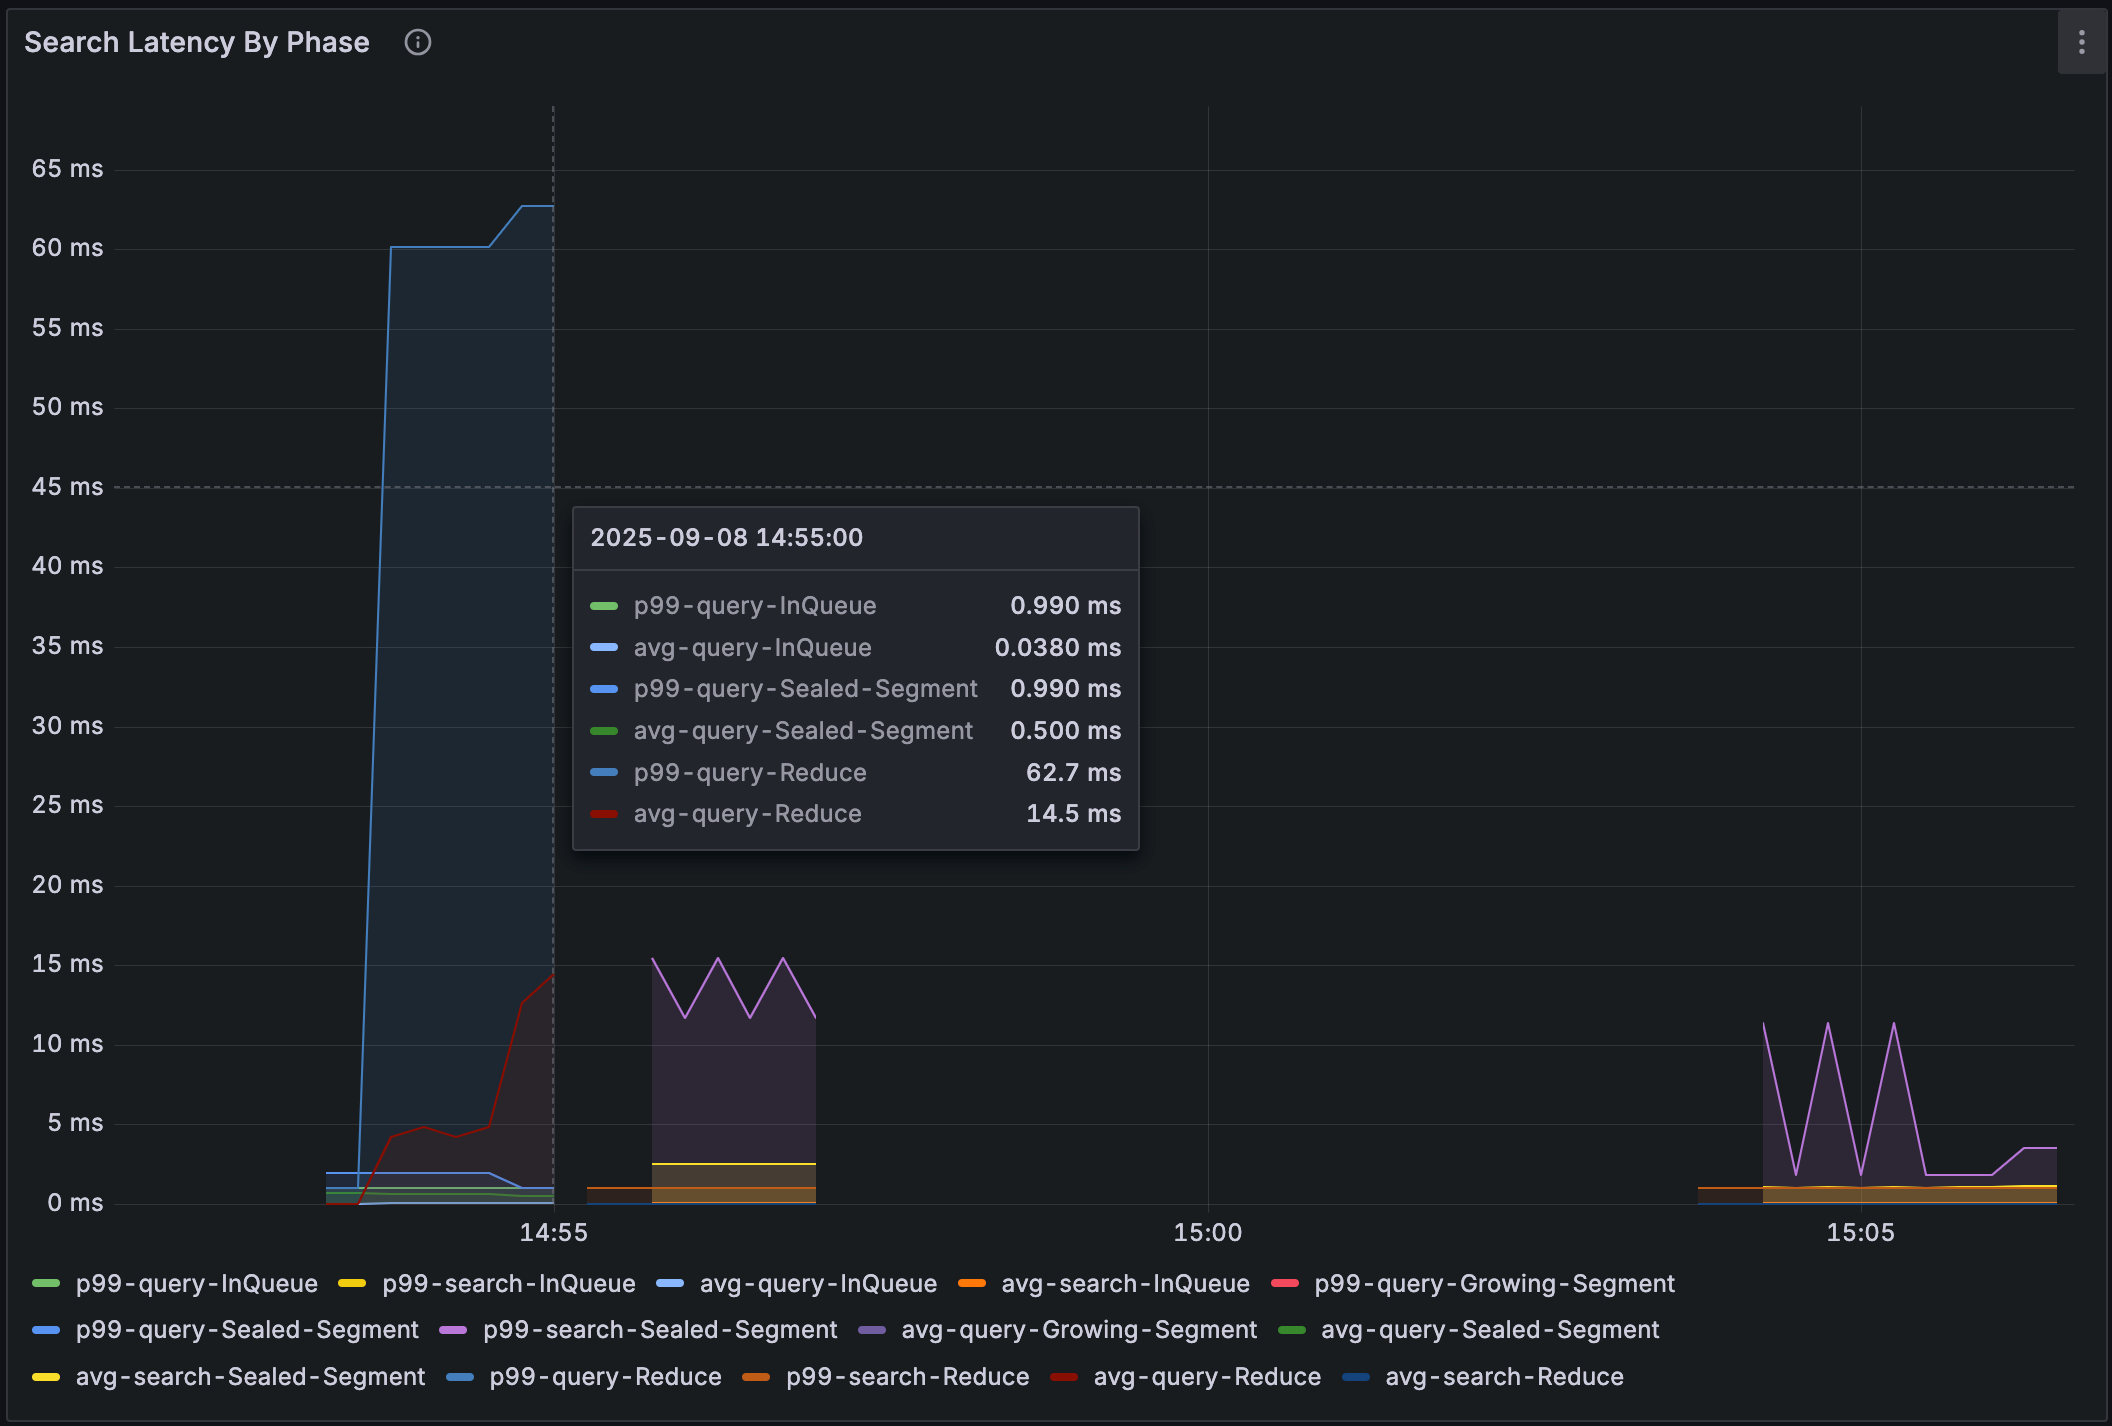
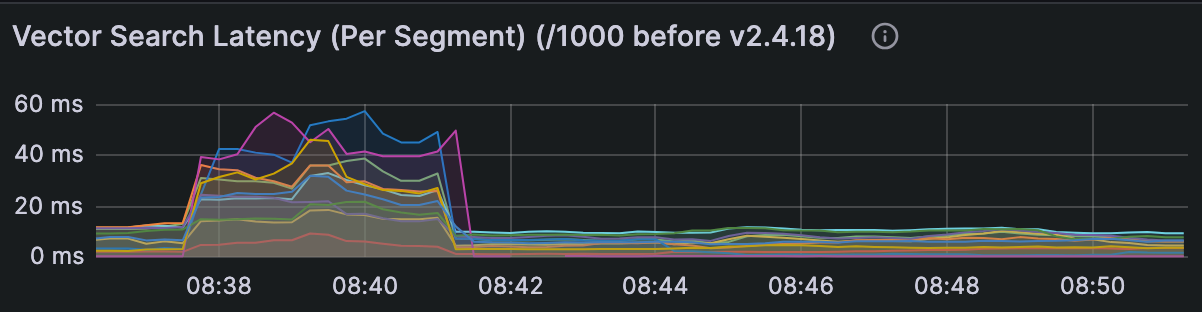
Query Node → Search Latency by Phase: Breaks latency into queue, query, and reduce stages. For deeper attribution, panels such as Scalar Filter Latency, Vector Search Latency, and Wait tSafe Latency reveal which stage dominates.
Milvus Logs
Milvus also logs any request lasting more than one second, tagged with markers like [Search slow]. These logs show which queries are slow, complementing the where insights from metrics. As a rule of thumb:
< 30 ms → healthy search latency in most scenarios
> 100 ms → worth investigating
> 1 s → definitely slow and requires attention
Example log:
[2025/08/23 19:22:19.900 +00:00] [INFO] [proxy/impl.go:3141] ["Search slow"] [traceID=9100b3092108604716f1472e4c7d54e4] [role=proxy] [db=default] [collection=my_repos] [partitions="[]"] [dsl="user == \"milvus-io\" && repo == \"proxy.slowQuerySpanInSeconds\""] [len(PlaceholderGroup)=8204] [OutputFields="[user,repo,path,descripion]"] [search_params="[{\"key\":\"topk\",\"value\":\"10\"},{\"key\":\"metric_type\",\"value\":\"COSINE\"},{\"key\":\"anns_field\",\"value\":\"vector\"},{\"key\":\"params\",\"value\":\"{\\\"nprobe\\\":256,\\\"metric_type\\\":\\\"COSINE\\\"}\"}]"] [ConsistencyLevel=Strong] [useDefaultConsistency=true] [guarantee_timestamp=460318735832711168] [nq=1] [duration=5m12.002784545s] [durationPerNq=5m12.002784545s]
In short, metrics tell you where the time is going; logs tell you which queries are hit.
Analyzing Root Cause
Heavy Workload
A common cause of slow requests is an excessive workload. When a request has a very large NQ (number of queries per request), it can run for an extended period and monopolize query node resources. Other requests stack up behind it, resulting in rising queue latency. Even if each request has a small NQ, a very high overall throughput (QPS) can still cause the same effect, as Milvus may merge concurrent search requests internally.
Signals to watch for:
All queries show unexpectedly high latency.
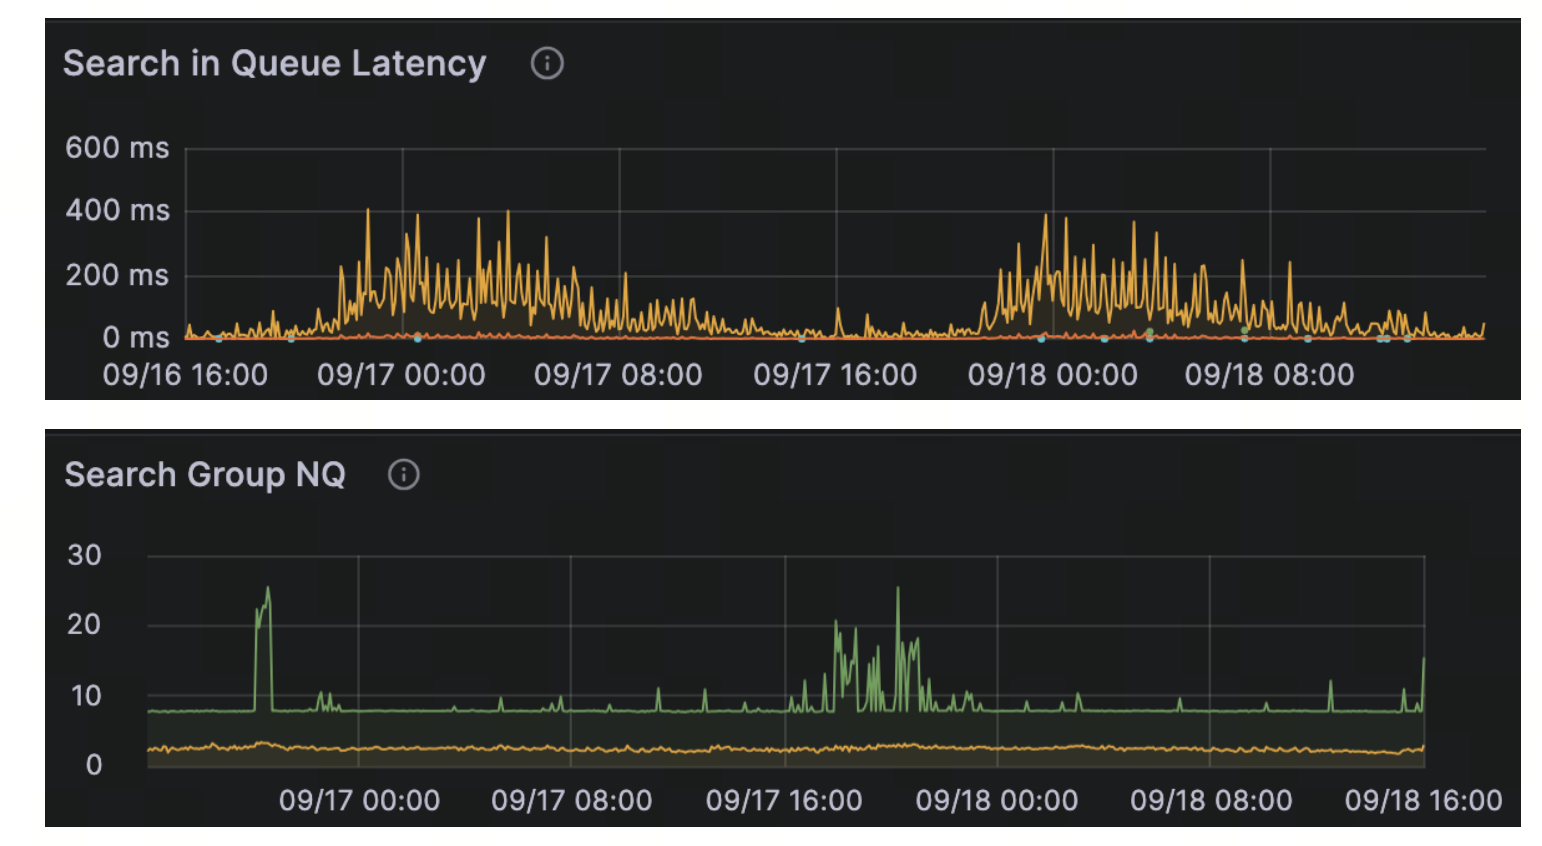
Query Node metrics report high in-queue latency.
Logs show a request with a large NQ and a long total duration, but a relatively small durationPerNQ—indicating that one oversized request is dominating resources.
How to fix it:
Batch queries: Keep NQ modest to avoid overloading a single request.
Scale out query nodes: If high concurrency is a regular part of your workload, add query nodes to spread the load and maintain low latency.
Inefficient Filtering
Another common bottleneck comes from inefficient filters. If filter expressions are poorly conducted or fields lack scalar indexes, Milvus may fall back to a full scan instead of scanning a small, targeted subset. JSON filters and strict consistency settings can further increase overhead.
Signals to watch for:
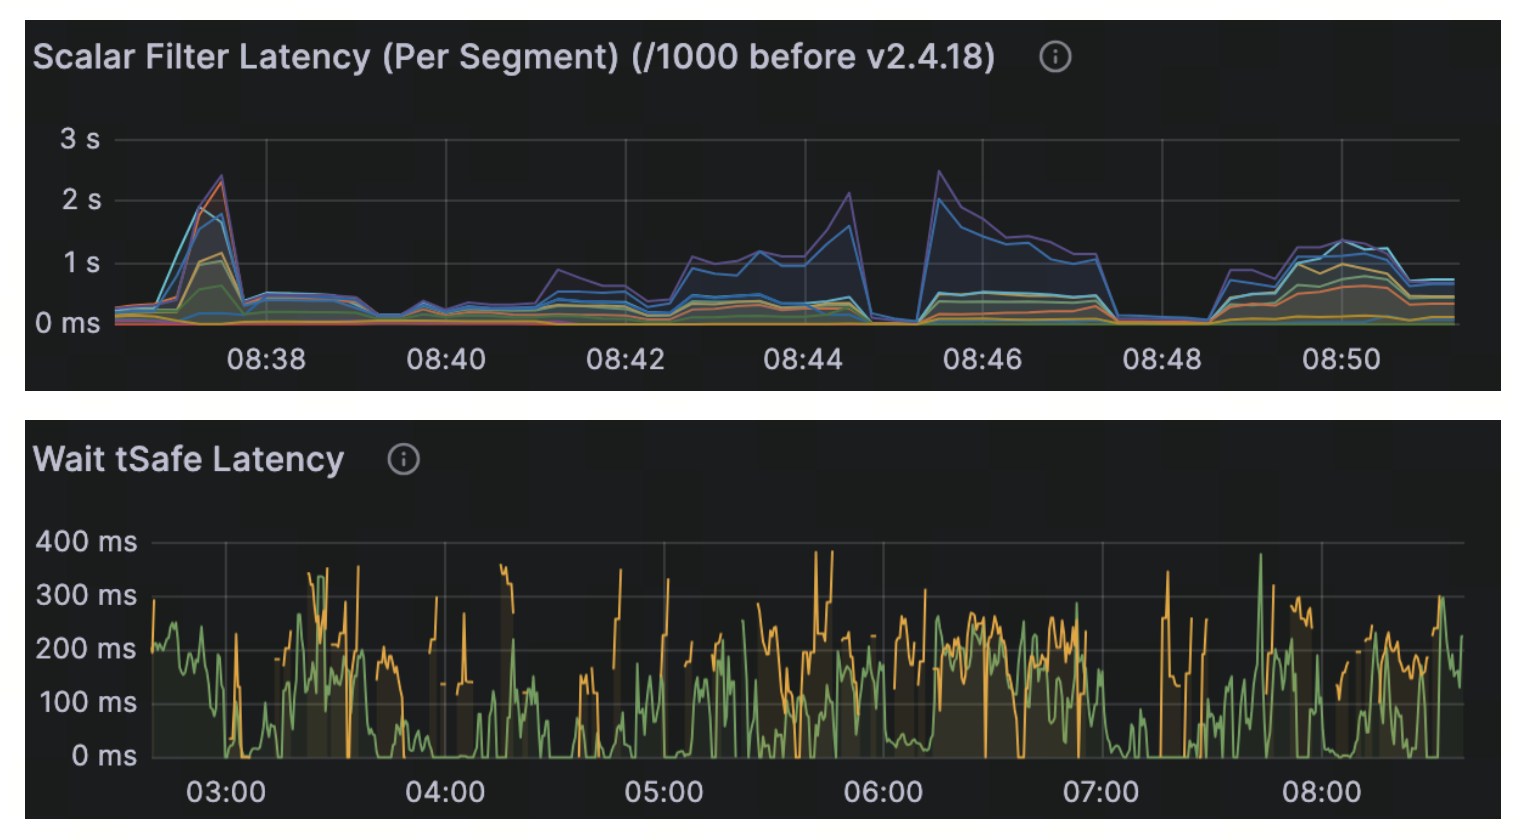
High Scalar Filter Latency in Query Node metrics.
Noticeable latency spikes only when filters are applied.
Long Wait tSafe Latency if strict consistency is enabled.
How to fix it:
- Simplify filter expressions: Reduce query plan complexity by optimizing filters. For example, replace long OR chains with an IN expression:
# Replace chains of OR conditions with IN
tag = {"tag": ["A", "B", "C", "D"]}
filter_expr = "tag IN {tag}"
Milvus also introduces a filter expression templating mechanism designed to improve efficiency by reducing the time spent parsing complex expressions. See this document for more details.
Add proper indexes: Avoid full scans by creating scalar indexes on fields used in filters.
Handle JSON efficiently: Milvus 2.6 introduced path and flat indexes for JSON fields, enabling efficient handling of JSON data. JSON shredding is also on the roadmap to further improve performance. Refer to the JSON field document for additional information.
Tune consistency level: Use Bounded or Eventually consistent reads when strict guarantees are not required, reducing tSafe wait time.
Improper Choice of Vector Index
Vector indexes are not one-size-fits-all. Selecting the wrong index can significantly impact latency. In-memory indexes deliver the fastest performance but consume more memory, while on-disk indexes save memory at the cost of speed. Binary vectors also require specialized indexing strategies.
Signals to watch for:
High Vector Search Latency in Query Node metrics.
Disk I/O saturation when using DiskANN or MMAP.
Slower queries immediately after restart due to cache cold start.
How to fix it:
Match index to workload (float vectors):
HNSW — best for in-memory use cases with high recall and low latency.
IVF family — flexible trade-offs between recall and speed.
DiskANN — supports billion-scale datasets, but requires strong disk bandwidth.
For binary vectors: Use the MINHASH_LSH index (introduced in Milvus 2.6) with the MHJACCARD metric to efficiently approximate Jaccard similarity.
Enable MMAP: Map index files into memory instead of keeping them fully resident to strike a balance between latency and memory usage.
Tune index/search parameters: Adjust settings to balance recall and latency for your workload.
Mitigate cold starts: Warm up frequently accessed segments after a restart to avoid initial query slowness.
Runtime & Environment Conditions
Not all slow queries are caused by the query itself. Query nodes often share resources with background jobs, such as compaction, data migration, or index building. Frequent upserts can generate many small, unindexed segments, forcing searches to scan raw data. In some cases, version-specific inefficiencies can also introduce latency until patched.
Signals to watch for:
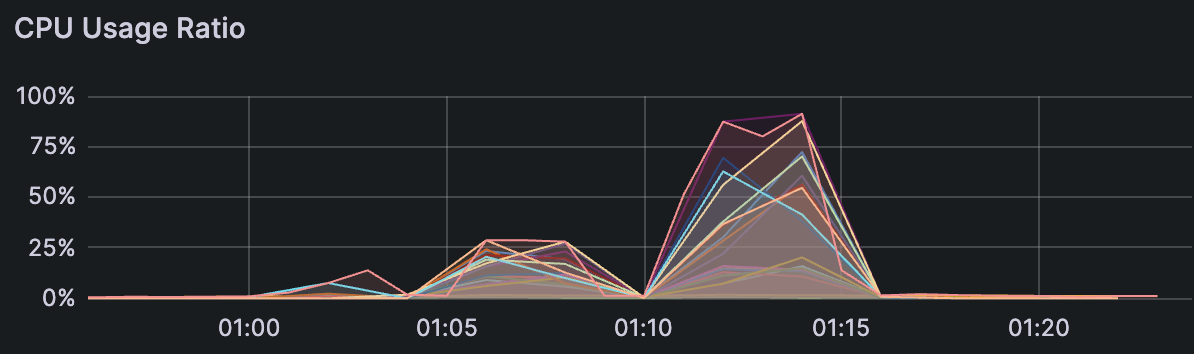
CPU usage spikes during background jobs (compaction, migration, index builds).
Disk I/O saturation affecting query performance.
Very slow cache warm-up after a restart.
Large numbers of small, unindexed segments (from frequent upserts).
Latency regressions tied to specific Milvus versions.
How to fix it:
Reschedule background tasks (e.g., compaction) to off-peak hours.
Release unused collections to free memory.
Account for warm-up time after restarts; pre-warm caches if needed.
Batch upserts to reduce the creation of tiny segments and let compaction keep up.
Stay current: upgrade to newer Milvus versions for bug fixes and optimizations.
Provision resources: dedicate extra CPU/memory to latency-sensitive workloads.
By matching each signal with the right action, most slow queries can be resolved quickly and predictably.
Best Practices to Prevent Slow Searches
The best debugging session is the one you never need to run. In our experience, a few simple habits go a long way toward preventing slow queries in Milvus:
Plan resource allocation to avoid CPU and disk contention.
Set proactive alerts for both failures and latency spikes.
Keep filter expressions short, simple, and efficient.
Batch upserts and keep NQ/QPS at sustainable levels.
Index all fields that are used in filters.
Slow queries in Milvus are rare, and when they do appear, they usually have clear, diagnosable causes. With metrics, logs, and a structured approach, you can quickly identify and resolve issues. This is the same playbook our support team uses every day — and now it’s yours too.
We hope this guide provides not only a troubleshooting framework but also the confidence to keep your Milvus workloads running smoothly and efficiently.
💡 Want to dive deeper?
Join the Milvus Discord to ask questions, share experiences, and learn from the community.
Sign up for our Milvus Office Hours to speak directly with the team and receive hands-on assistance with your workloads.
- Identifying Slow Searches
- Milvus Metrics
- Milvus Logs
- Analyzing Root Cause
- Heavy Workload
- Inefficient Filtering
- Improper Choice of Vector Index
- Runtime & Environment Conditions
- Best Practices to Prevent Slow Searches
- 💡 Want to dive deeper?
On This Page
Try Managed Milvus for Free
Zilliz Cloud is hassle-free, powered by Milvus and 10x faster.
Get StartedLike the article? Spread the word