Configure Grafana Loki
This guide provides instructions on how to configure Loki to collect logs and Grafana to query and display logs for a Milvus cluster.
In this guide, you will learn how to:
- Deploy Loki and Alloy on a Milvus cluster using Helm.
- Configure object storage for Loki.
- Query logs using Grafana.
For reference, Promtail will be deprecated. So we introduce Alloy, which has been officially suggested by Grafana Labs as the new agent to collect Kubernetes logs and forward them to Loki.
Prerequisites
- You have installed a Milvus cluster on K8s.
- You have installed necessary tools, including Helm and Kubectl.
Deploy Loki
Loki is a log aggregation system inspired by Prometheus. Deploy Loki using Helm to collect logs from your Milvus cluster.
1. Add Grafana’s Helm Chart Repository
Add Grafana’s chart repository to Helm and update it:
helm repo add grafana https://grafana.github.io/helm-charts
helm repo update
2. Configure Object Storage for Loki
Choose one of the following storage options and create a loki.yaml configuration file:
Option 1: Using MinIO for storage
loki:
  commonConfig:
    replication_factor: 1
  auth_enabled: false

minio:
  enabled: true
Option 2: Using AWS S3 for storage
In the following example, replace
<accessKey>and<keyId>with your own S3 access key and ID,s3.endpointwith the S3 endpoint, ands3.regionwith the S3 region.loki: commonConfig: replication_factor: 1 auth_enabled: false storage: bucketNames: chunks: loki-chunks ruler: loki-ruler admin: loki-admin type: 's3' s3: endpoint: s3.us-west-2.amazonaws.com region: us-west-2 secretAccessKey: <accessKey> accessKeyId: <keyId>
3. Install Loki
Run the following commands to install Loki:
kubectl create ns loki
helm install --values loki.yaml loki grafana/loki -n loki
Deploy Alloy
We will show you Alloy Configuration.
1. Create Alloy Configuration
We will use the following alloy.yaml to collect logs of all Kubernetes pods & send them to Loki via loki-gateway:
alloy:
  enableReporting: false
  resources: {}
  configMap:
    create: true
    content: |-
      loki.write "default" {
        endpoint {
          url = "http://loki-gateway/loki/api/v1/push"
        }
      }

      discovery.kubernetes "pod" {
        role = "pod"
      }

      loki.source.kubernetes "pod_logs" {
        targets    = discovery.relabel.pod_logs.output
        forward_to = [loki.write.default.receiver]
      }

      // Rewrite the label set to make log query easier
      discovery.relabel "pod_logs" {
        targets = discovery.kubernetes.pod.targets
        rule {
          source_labels = ["__meta_kubernetes_namespace"]
          action = "replace"
          target_label = "namespace"
        }

        // "pod" <- "__meta_kubernetes_pod_name"
        rule {
          source_labels = ["__meta_kubernetes_pod_name"]
          action = "replace"
          target_label = "pod"
        }

        // "container" <- "__meta_kubernetes_pod_container_name"
        rule {
          source_labels = ["__meta_kubernetes_pod_container_name"]
          action = "replace"
          target_label = "container"
        }

        // "app" <- "__meta_kubernetes_pod_label_app_kubernetes_io_name"
        rule {
          source_labels = ["__meta_kubernetes_pod_label_app_kubernetes_io_name"]
          action = "replace"
          target_label = "app"
        }

        // "job" <- "__meta_kubernetes_namespace", "__meta_kubernetes_pod_container_name"
        rule {
          source_labels = ["__meta_kubernetes_namespace", "__meta_kubernetes_pod_container_name"]
          action = "replace"
          target_label = "job"
          separator = "/"
          replacement = "$1"
        }

        // L"__path__" <- "__meta_kubernetes_pod_uid", "__meta_kubernetes_pod_container_name"
        rule {
          source_labels = ["__meta_kubernetes_pod_uid", "__meta_kubernetes_pod_container_name"]
          action = "replace"
          target_label = "__path__"
          separator = "/"
          replacement = "/var/log/pods/*$1/*.log"
        }

        // "container_runtime" <- "__meta_kubernetes_pod_container_id"
        rule {
          source_labels = ["__meta_kubernetes_pod_container_id"]
          action = "replace"
          target_label = "container_runtime"
          regex = "^(\\S+):\\/\\/.+$"
          replacement = "$1"
        }
      }
2. Install Alloy
helm install --values alloy.yaml alloy grafana/alloy -n loki
Query Logs with Grafana
Deploy Grafana and configure it to connect to Loki for querying logs.
1. Deploy Grafana
Install Grafana using the following commands:
kubectl create ns monitoring
helm install my-grafana grafana/grafana --namespace monitoring
Before you can access Grafana, you need to retrieve the admin password:
kubectl get secret --namespace monitoring my-grafana -o jsonpath="{.data.admin-password}" | base64 --decode ; echo
Then, forward the Grafana port to your local machine:
export POD_NAME=$(kubectl get pods --namespace monitoring -l "app.kubernetes.io/name=grafana,app.kubernetes.io/instance=my-grafana" -o jsonpath="{.items[0].metadata.name}")
kubectl --namespace monitoring port-forward $POD_NAME 3000
2. Add Loki as a Data Source in Grafana
Once Grafana is running, you need to add Loki as a data source to query logs.
- Open a web browser and navigate to
127.0.0.1:3000. Log in using the usernameadminand the password obtained earlier. - In the left-side menu, choose Connections > Add new connection.
- On the page that appears, choose Loki as the data source type. You can enter loki in the search bar to find the data source.
- In the Loki data source settings, specify the Name and URL, and then click Save & test.
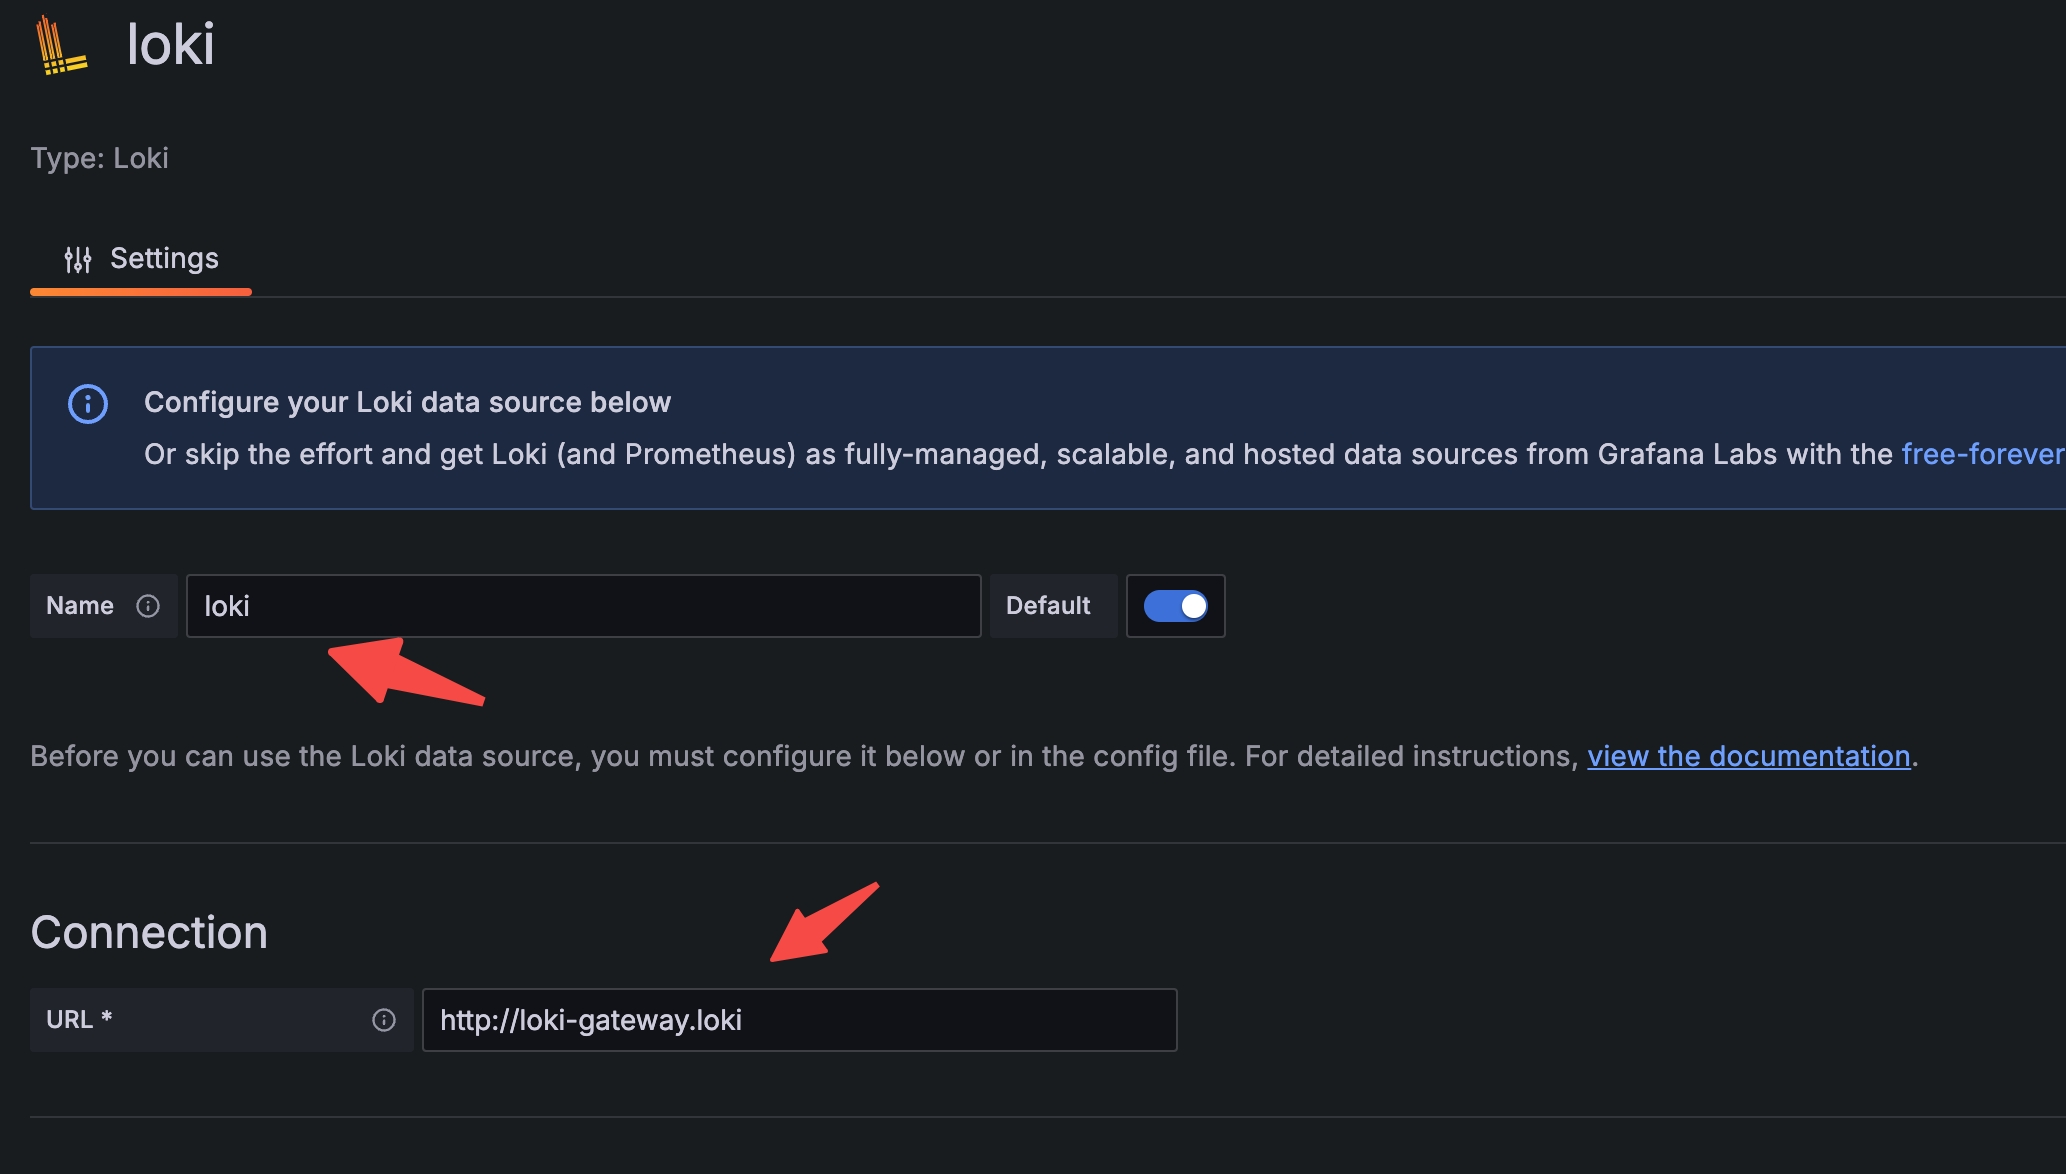 DataSource
3. Query Milvus Logs
After adding Loki as a data source, query Milvus logs in Grafana:
- In the left-side menu, click Explore.
- In the upper-left corner of the page, choose the loki data source.
- Use Label browser to select labels and query logs.
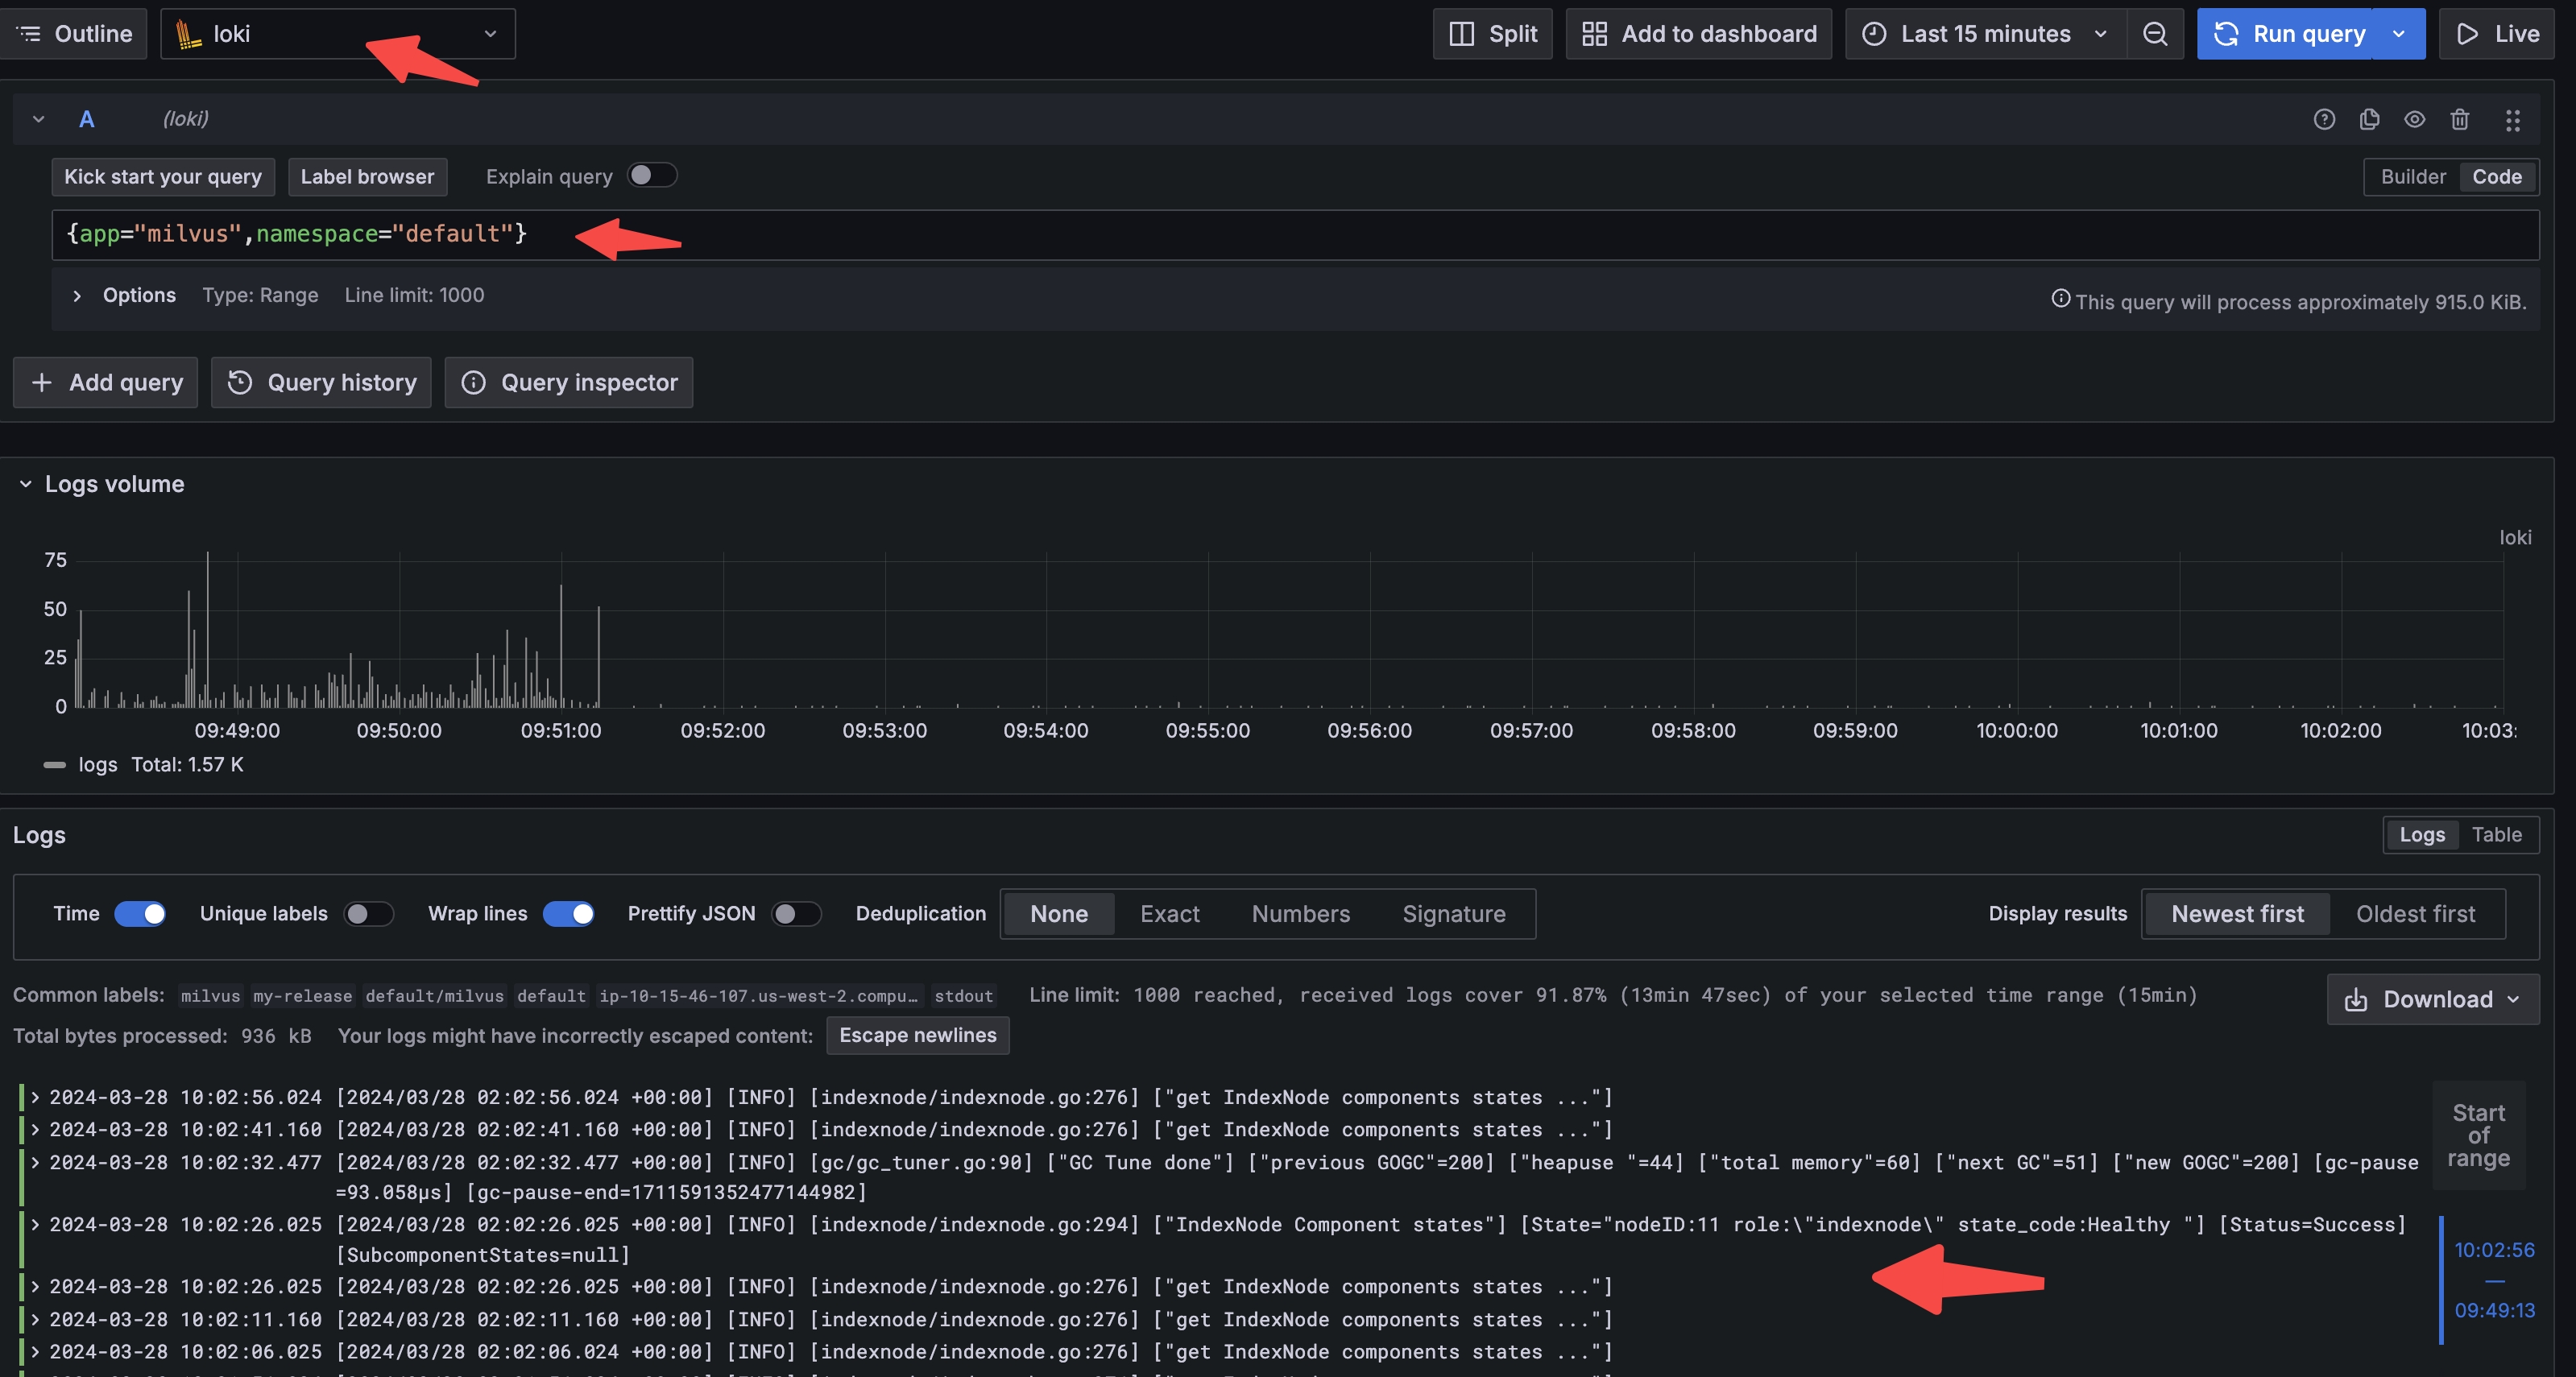 Query
Query