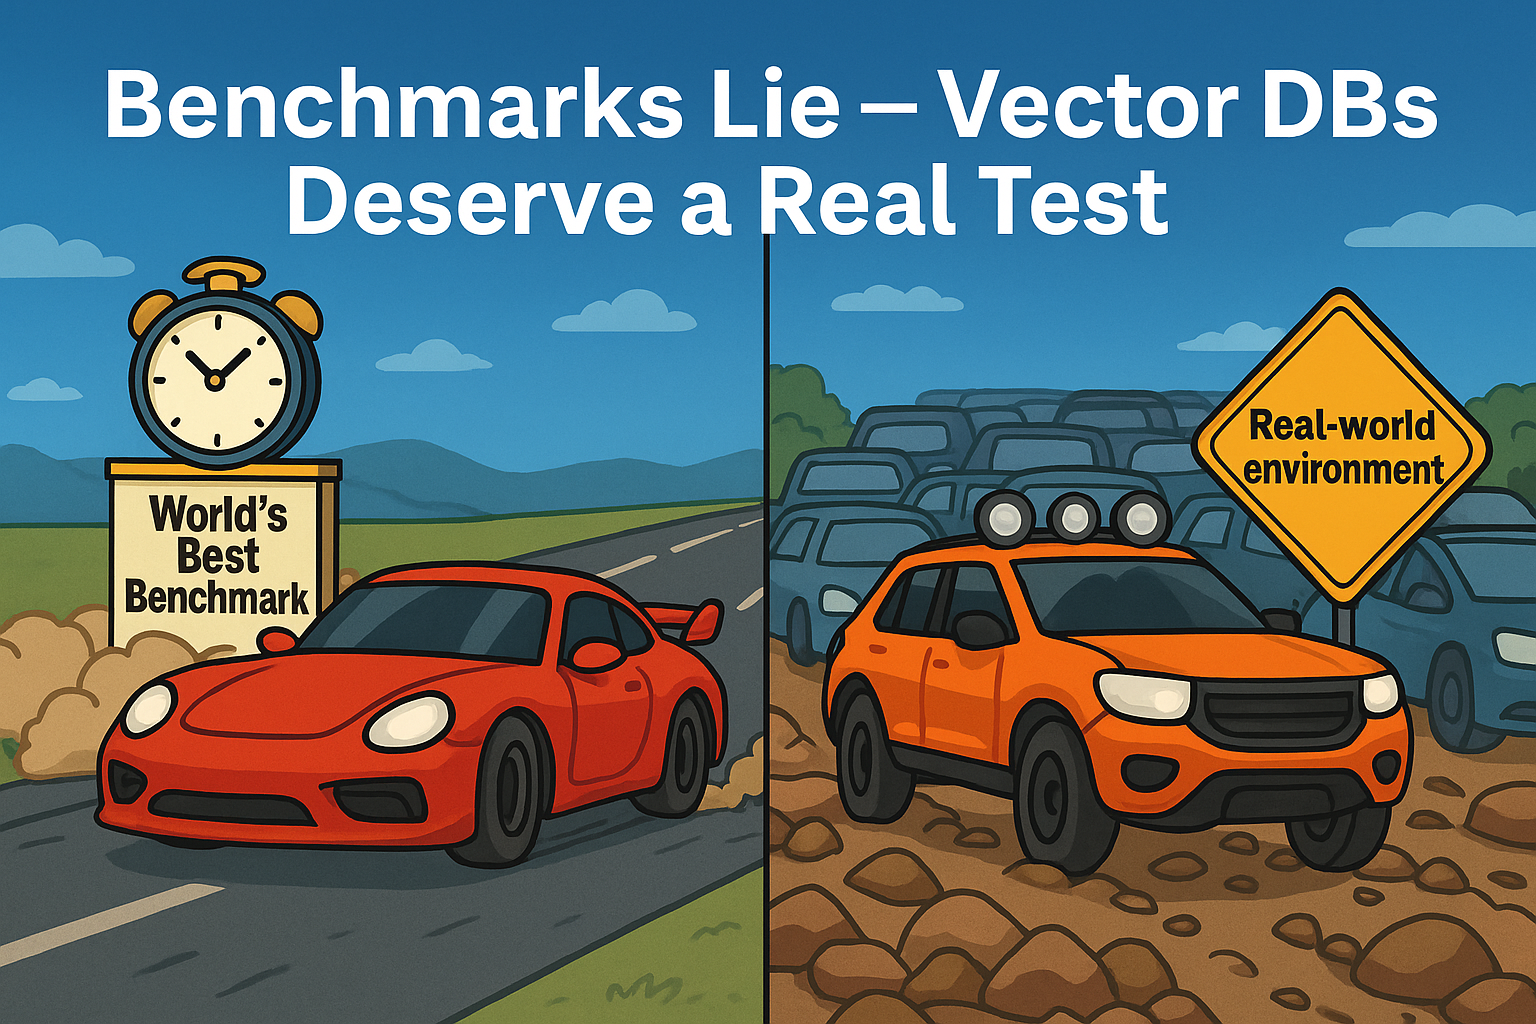
Benchmarks Lie — Vector DBs Deserve a Real Test
The Vector Database You Chose Based on Benchmarks Might Fail in Production
When selecting a vector database for your AI application, conventional benchmarks are like test-driving a sports car on an empty track, only to find it stalls in rush hour traffic. The uncomfortable truth? Most benchmarks only evaluate performance in artificial conditions that never exist in production environments.
Most benchmarks test vector databases after all data has been ingested and the index is fully built. But in production, data never stops flowing. You don’t get to pause your system for hours to rebuild an index.
We’ve seen the disconnect firsthand. For example, Elasticsearch might boast millisecond-level query speeds, but behind the scenes, we’ve watched it take over 20 hours just to optimize its index. That’s downtime no production system can afford, especially in AI workloads that demand continuous updates and instant responses.
With Milvus, after running countless Proof of Concept (PoC) evaluations with enterprise clients, we’ve uncovered a troubling pattern: vector databases that excel in controlled lab environments frequently struggle under actual production loads. This critical gap doesn’t just frustrate infrastructure engineers—it can derail entire AI initiatives built on these misleading performance promises.
That’s why we built VDBBench: an open-source benchmark designed from the ground up to simulate production reality. Unlike synthetic tests that cherry-pick scenarios, VDBBench pushes databases through continuous ingestion, rigorous filtering conditions, and diverse scenarios, just like your actual production workloads. Our mission is simple: give engineers a tool that shows how vector databases actually perform under real-world conditions so you can make infrastructure decisions based on trustworthy numbers.
The Gap between Benchmarks and Reality
Traditional benchmarking approaches suffer from three critical flaws that render their results practically meaningless for production decision-making:
1. Outdated Data
Many benchmarks still rely on outdated datasets like SIFT or GloVe, which bear little resemblance to today’s complex, high-dimensional vector embeddings generated by AI models. Consider this: SIFT contains 128-dimensional vectors, while popular embeddings from OpenAI’s embedding models range from 768 to 3072 dimensions.
2. Vanity Metrics
Many benchmarks focus solely on average latency or peak QPS, which creates a distorted picture. These idealized metrics fail to capture the outliers and inconsistencies that actual users experience in production environments. For example, what good is an impressive QPS number if it requires unbounded computational resources that would bankrupt your organization?
3. Oversimplified Scenarios
Most benchmarks test only basic, static workloads—essentially the “Hello World” of vector search. For example, they issue search requests only after the entire dataset is ingested and indexed, ignoring the dynamic reality where users search while new data streams in. This simplistic design overlooks the complex patterns defining real production systems such as concurrent queries, filtered searches, and continuous data ingestion.
Recognizing these flaws, we realized the industry needed a radical shift in benchmarking philosophy—one grounded in how AI systems actually behave in the wild. That’s why we built VDBBench.
From Lab to Production: How VDBBench Bridges the Gap
VDBBench doesn’t just iterate on outdated benchmarking philosophies—it rebuilds the concept from first principles with one guiding belief: a benchmark is only valuable if it predicts actual production behavior.
We’ve engineered VDBBench to faithfully replicate real-world conditions across three critical dimensions: data authenticity, workload patterns, and performance measurement.
Modernizing the Dataset
We’ve completely overhauled the datasets used for vectorDB benchmarking. Instead of legacy test sets like SIFT and GloVe, VDBBench uses vectors generated from state-of-the-art embedding models that power today’s AI applications.
To ensure relevance, especially for use cases like Retrieval-Augmented Generation (RAG), we selected corpora that reflect real-world enterprise and domain-specific scenarios. These range from general-purpose knowledge bases to vertical applications like biomedical question answering and large-scale web search.
| Corpus | Embedding Model | Dimensions | Size |
| Wikipedia | Cohere V2 | 768 | 1M / 10M |
| BioASQ | Cohere V3 | 1024 | 1M / 10M |
| C4 | OpenAI | 1536 | 500K / 5M |
| MSMarco V2 | udever-bloom-1b1 | 1536 | 1M / 10M / 138M |
Table: Datasets used in VDBBench
VDBBench also supports custom datasets, letting you benchmark with your own data generated from your specific embedding models for your specific workloads. After all, no dataset tells a better story than your own production data.
Production-Focused Metric Design
VDBBench prioritizes metrics that reflect real-world performance, not just lab results. We’ve redesigned benchmarking around what actually matters in production environments: reliability under load, tail latency, sustained throughput, and accuracy.
P95/P99 latency to measure real user experience: Average/median latency masks the outliers that frustrate real users. That’s why VDBBench focuses on tail latency like P95/P99, revealing what performance 95% or 99% of your queries will actually achieve.
Sustainable throughput under load: A system that performs well for 5 seconds doesn’t cut it in production. VDBBench gradually increases concurrency to find your database’s maximum sustainable queries per second (
max_qps)—not the peak number under short, ideal conditions. This shows how well your system holds up over time.Recall balanced with performance: Speed without accuracy is meaningless. Every performance number in VDBBench is paired with recall, so you know exactly how much relevance you’re trading off for throughput. This enables fair, apples-to-apples comparisons between systems with vastly different internal tradeoffs.
Test Methodology That Reflects Reality
A key innovation in VDBBench’s design is the separation of serial and concurrent testing, which helps capture how systems behave under different types of load. For instance, latency metrics are divided as follows:
serial_latency_p99measures system performance under minimal load, where only one request is processed at a time. This represents the best-case scenario for latency.conc_latency_p99captures system behavior under realistic, high-concurrency conditions, where multiple requests arrive simultaneously.
Two Benchmark Phases
VDBBench separates testing into two crucial phases:
- Serial Test
This is a single-process run of 1,000 queries. This phase establishes a baseline for ideal performance and accuracy, reporting both serial_latency_p99 and recall.
- Concurrency Test
This phase simulates a production environment under sustained load.
Realistic client simulation: Each test process operates independently with its own connection and query set. This avoids shared-state (e.g., cache) interference that could distort results.
Synchronized start: All processes begin simultaneously, ensuring that the measured QPS accurately reflects the claimed concurrency level.
These carefully structured methods ensure that the max_qps and conc_latency_p99 values reported by VDBBench are both accurate and production-relevant, providing meaningful insights for production capacity planning and system design.
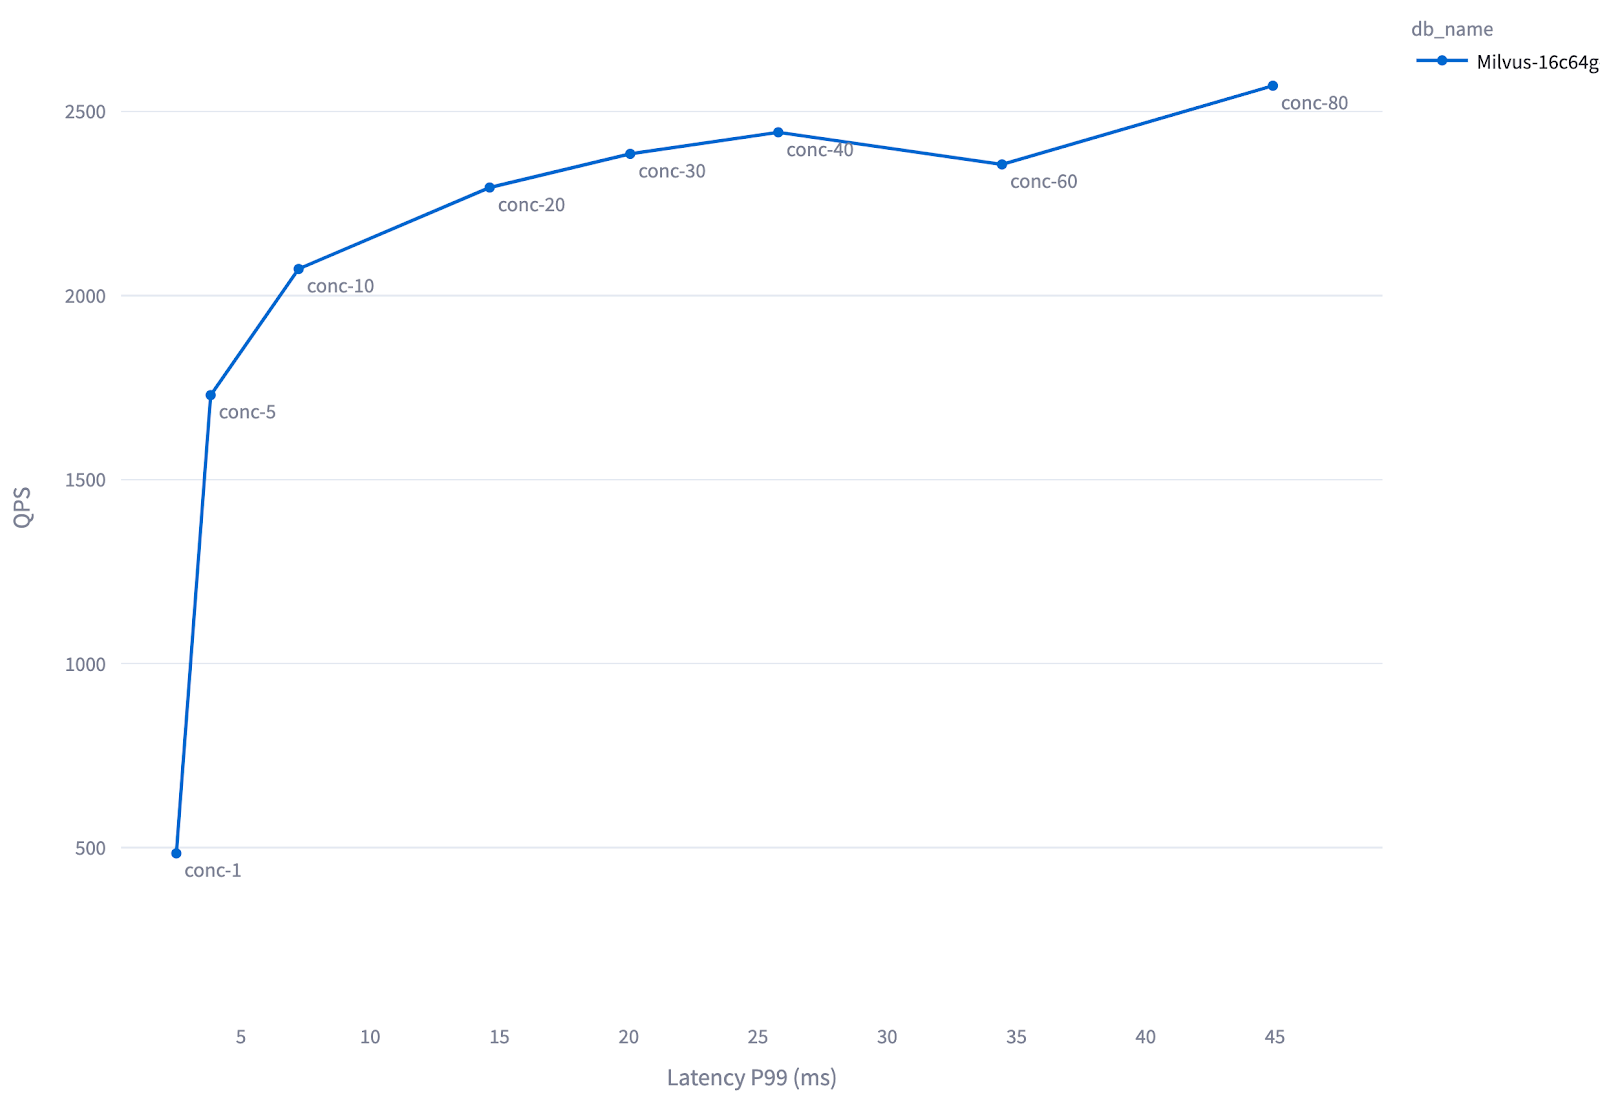
Figure: QPS and Latency of Milvus-16c64g-standalone at Varying Concurrency Levels (Cohere 1M Test). In this test, Milvus is initially underutilized—up to concurrency level 20, increasing concurrency improves system utilization and results in higher QPS. Beyond concurrency 20, the system reaches full load: further increases in concurrency no longer improve throughput, and latency rises due to queuing delays.
Beyond Searching Static Data: The Real Production Scenarios
To the best of our knowledge, VDBBench is the only benchmark tool that tests vector databases across the complete spectrum of production-critical scenarios, including static collection, filtering, and streaming cases.
Static Collection
Unlike other benchmarks that rush into testing, VDBBench first ensures each database has fully optimized its indexes—a critical production prerequisite that many benchmarks often neglect. This gives you the complete picture:
Data ingestion time
Indexing time (the time used to build an optimized index, which dramatically affects search performance)
Search performance on fully optimized indexes under both serial and concurrent conditions
Filtering
Vector search in production rarely happens in isolation. Real applications combine vector similarity with metadata filtering (“find shoes that look like this photo but cost under $100”). This filtered vector search creates unique challenges:
Filter Complexity: More scalar columns and logic conditions increase computational demands
Filter Selectiveness: Our production experience reveals this as the hidden performance killer—query speeds can fluctuate by orders of magnitude depending on how selective filters are
VDBBench systematically evaluates filter performance across varying selectivity levels (from 50% to 99.9%), delivering a comprehensive profile of how databases handle this critical production pattern.
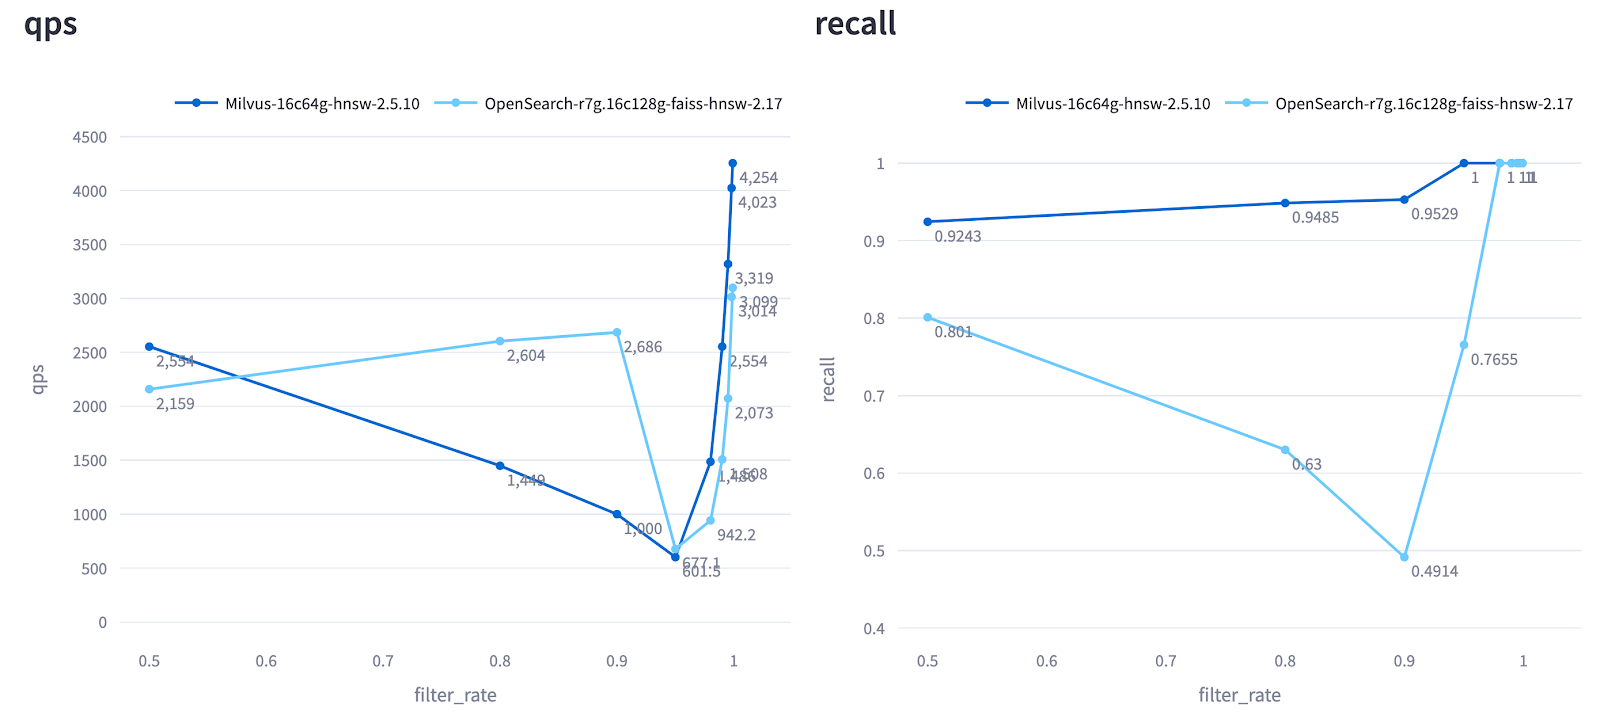
Figure: QPS and Recall of Milvus and OpenSearch Across Different Filter Selectivity Levels (Cohere 1M Test). The X-axis represents the percentage of data filtered. As shown, Milvus maintains consistently high recall across all filter selectivity levels, while OpenSearch exhibits unstable performance, with recall fluctuating significantly under different filtering conditions.
Streaming
Production systems rarely enjoy the luxury of static data. New information continuously flows in while searches execute—a scenario where many otherwise impressive databases collapse.
VDBBench’s unique streaming test case examines search-while-inserting performance, measuring:
Impact of Growing Data Volume: How search performance scales with increasing data size.
Impact of Write Load: How concurrent writes affect search latency and throughput, as write also consumes CPU or memory resources in the system.
Streaming scenarios represent a comprehensive stress test for any vector database. But building a fair benchmark for this isn’t trivial. It’s not enough to describe how one system behaves—we need a consistent evaluation model that enables apples-to-apples comparisons across different databases.
Drawing from our experience helping enterprises with real-world deployments, we built a structured, repeatable approach. With VDBBench:
You define a fixed insertion rate that mirrors your target production workload.
VDBBench then applies identical load pressure across all systems, ensuring performance results are directly comparable.
For example, with a Cohere 10M dataset and a 500 rows/second ingestion target:
VDBBench spins up 5 parallel producer processes, each inserting 100 rows per second.
After every 10% of data is ingested, VDBBench triggers a round of search testing under both serial and concurrent conditions.
Metrics such as latency, QPS, and recall are recorded after each stage.
This controlled methodology reveals how each system’s performance evolves over time and under real operational stress—giving you the insight you need to make infrastructure decisions that scale.
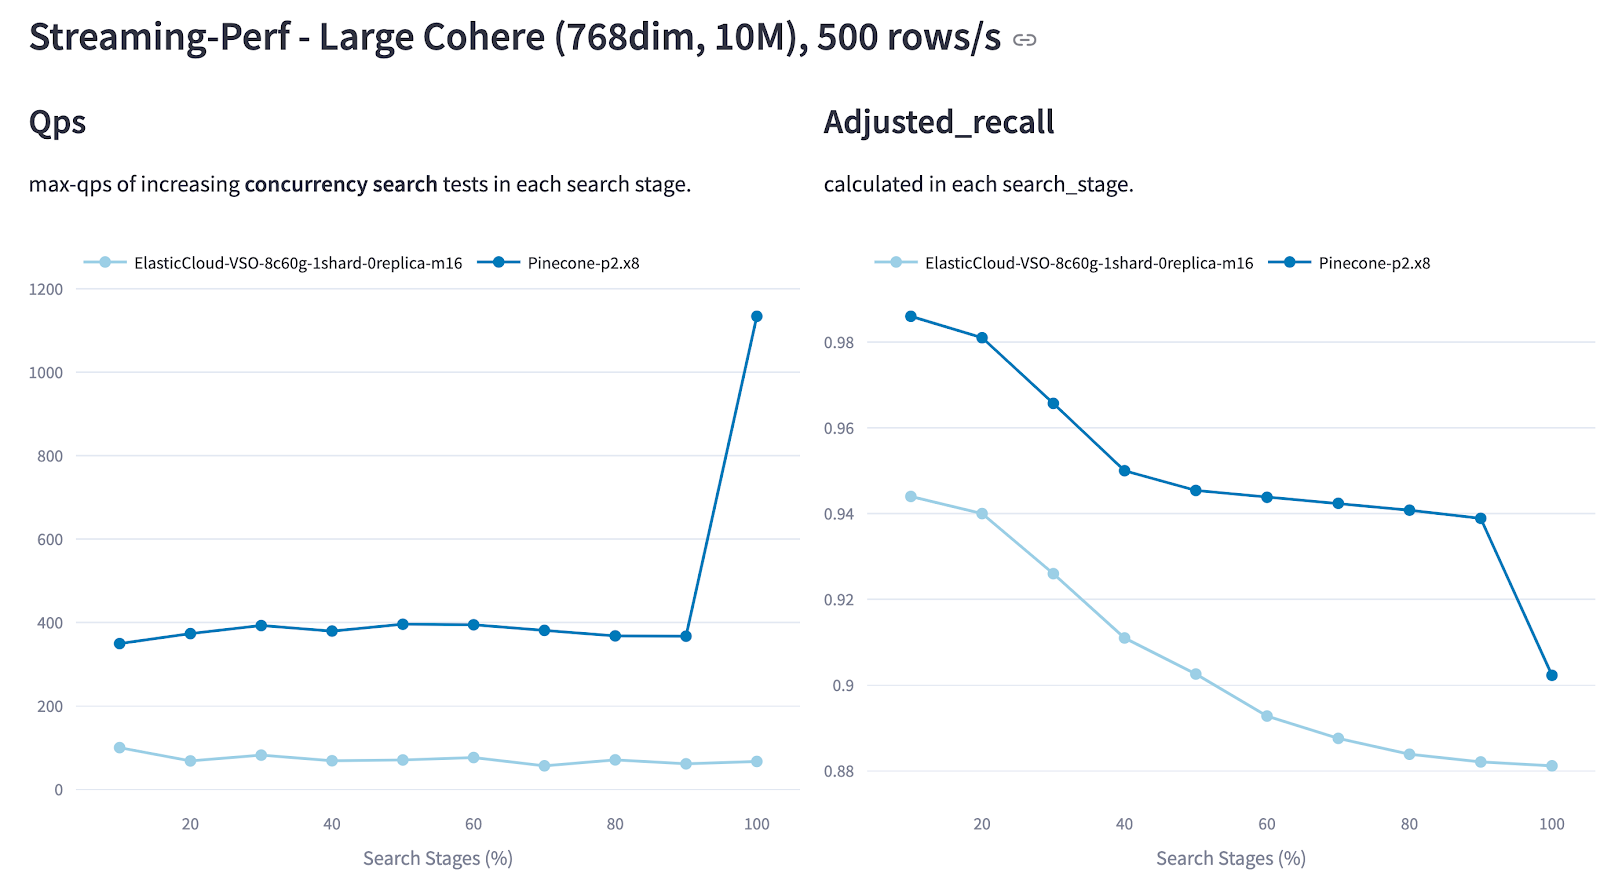
Figure: QPS and Recall of Pinecone vs. Elasticsearch in the Cohere 10M Streaming Test (500 rows/s Ingestion Rate). Pinecone maintained higher QPS and recall, showing a significant QPS improvement after inserting 100% of the data.
But this is not the end of the story. VDBBench goes even further by supporting an optional optimization step, allowing users to compare streaming search performance before and after index optimization. It also tracks and reports the actual time spent on each stage, offering deeper insights into system efficiency and behavior under production-like conditions.
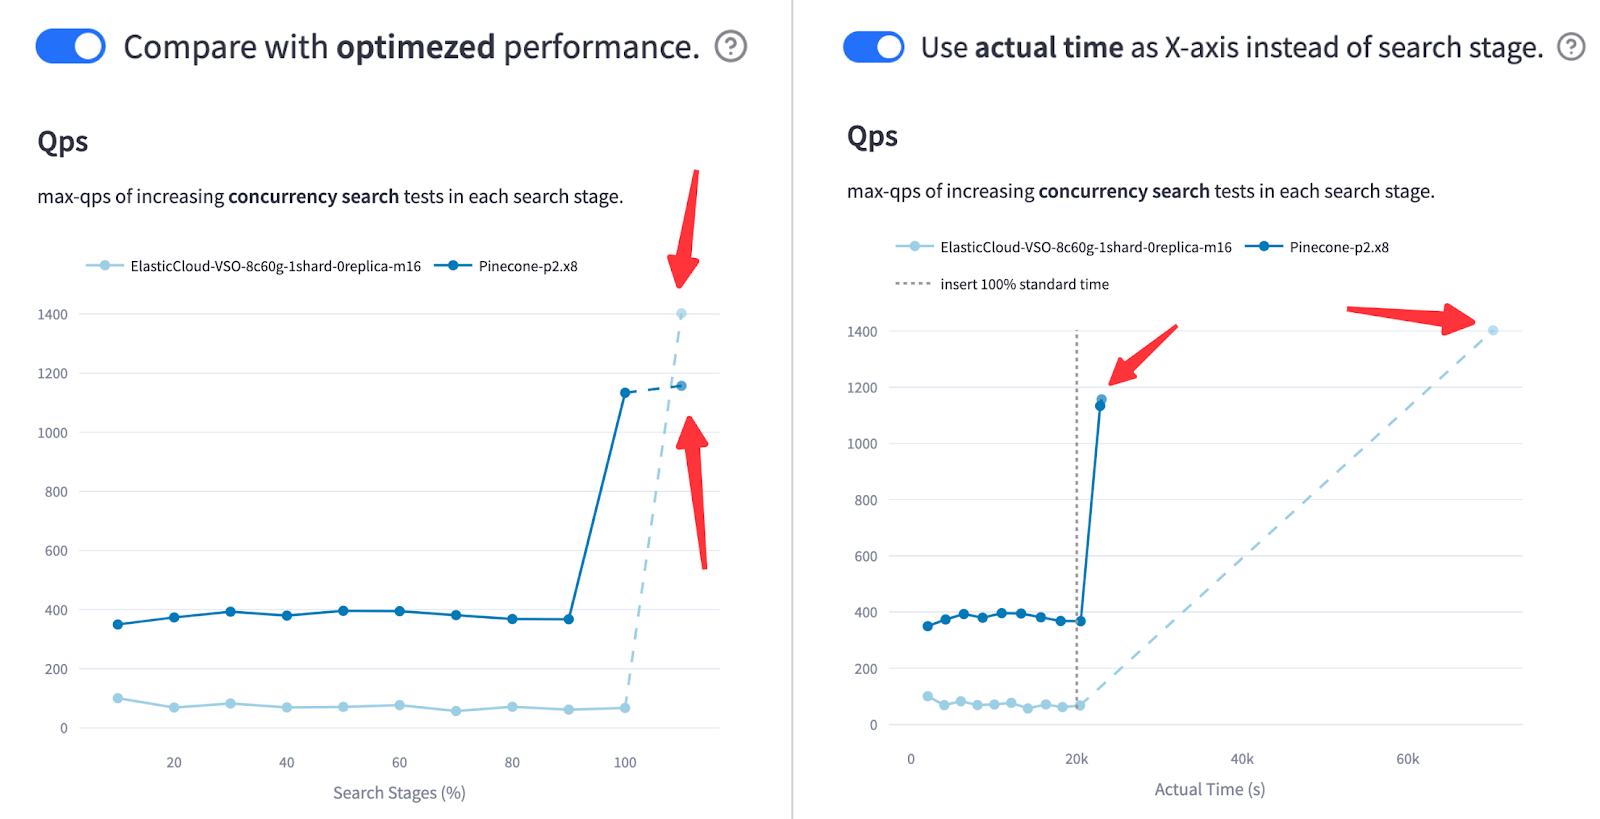
Figure: QPS and Recall of Pinecone vs. Elasticsearch in the Cohere 10M Streaming Test After Optimization (500 rows/s Ingestion Rate)
As shown in the diagram, ElasticSearch surpassed Pinecone in QPS—after index optimization. A miracle? Not quite. The right chart tells the full story: once the x-axis reflects actual elapsed time, it’s clear that ElasticSearch took significantly longer to reach that performance. And in production, that delay matters. This comparison reveals a key tradeoff: peak throughput vs. time-to-serve.
Choose Your Vector Database with Confidence
The gap between benchmark results and real-world performance shouldn’t be a guessing game. VDBBench provides a way to evaluate vector databases under realistic, production-like conditions, including continuous data ingestion, metadata filtering, and streaming workloads.
If you’re planning to deploy a vector database in production, it’s worth understanding how it performs beyond idealized lab tests. VDBBench is open-source, transparent, and designed to support meaningful, apples-to-apples comparisons.
Try VDBBench with your own workloads today and see how different systems hold up in practice: https://github.com/zilliztech/VectorDBBench.
Have questions or want to share your results? Join the conversation on GitHub or connect with our community on Discord. We’d love to hear your opinions.
- The Vector Database You Chose Based on Benchmarks Might Fail in Production
- The Gap between Benchmarks and Reality
- 1. Outdated Data
- 2. Vanity Metrics
- 3. Oversimplified Scenarios
- From Lab to Production: How VDBBench Bridges the Gap
- Modernizing the Dataset
- Production-Focused Metric Design
- Test Methodology That Reflects Reality
- Two Benchmark Phases
- Beyond Searching Static Data: The Real Production Scenarios
- Static Collection
- Filtering
- Streaming
- Choose Your Vector Database with Confidence
On This Page
Try Managed Milvus for Free
Zilliz Cloud is hassle-free, powered by Milvus and 10x faster.
Get StartedLike the article? Spread the word