How to Set Up OpenTelemetry with Milvus for End-to-End Request Tracing
Introduction
When building AI-powered applications with vector databases, understanding system performance becomes critical as your application scales. A single search request might trigger multiple internal operations—vector indexing, similarity calculations, and data retrieval—across different components. Without proper observability, diagnosing slowdowns or failures becomes like finding a needle in a haystack.
Distributed tracing solves this problem by tracking requests as they flow through your system, giving you a complete picture of what’s happening under the hood.
OpenTelemetry (OTEL) is an open-source observability framework backed by the Cloud Native Computing Foundation (CNCF) that helps you collect traces, metrics, and logs from your applications. It’s vendor-neutral, widely adopted, and works seamlessly with popular monitoring tools.
In this guide, we’ll show you how to add end-to-end tracing to Milvus, a high-performance vector database built for AI applications. You’ll learn to track everything from client requests to internal database operations, making performance optimization and debugging much easier.
We’ll also utilize Jaeger to visualize the trace data, providing you with powerful insights into your vector database operations.
What We’ll Build
By the end of this tutorial, you’ll have a complete tracing pipeline consisting of:
Milvus vector database with OpenTelemetry tracing enabled
Jaeger for trace visualization and analysis
A Python client that automatically traces all Milvus operations
End-to-end visibility from client requests to database operations
Estimated setup time: 15-20 minutes
Quick Start (5 Minutes)
Want to see it working first? Here’s the fastest path:
- Clone the demo repository:
git clone https://github.com/topikachu/milvus-py-otel
cd milvus-py-otel
- Start the services:
docker-compose up -d
Wait 30 seconds, then check Jaeger UI at:
http://localhost:16686Run the Python example:
pip install -r requirements.txt
python example.py
- Refresh Jaeger and look for traces from both
standalone(Milvus) andmilvus-clientservices.
If you see traces appearing, everything is working! Now let’s understand how it all fits together.
Environment Setup
Here’s what you’ll need:
Milvus 2.5.11 (vector database)
Jaeger 1.46.0 (trace visualization)
Python 3.7+ (client development)
Docker and Docker Compose (container orchestration)
These versions have been tested together; however, newer versions should also work fine.
Setting Up Milvus and Jaeger
We’ll use Docker Compose to run both services with proper networking and configuration.
Docker Compose Configuration
Create a docker-compose.yaml file:
version: '3.7'
Services:
# Milvus - configured to send traces to Jaeger
  milvus:
    image: milvusdb/milvus:v2.5.11
    command: ["milvus", "run", "standalone"]
    environment:
      - ETCD_USE_EMBED=true
      - ETCD_DATA_DIR=/var/lib/milvus/etcd
      - ETCD_CONFIG_PATH=/milvus/configs/embedEtcd.yaml
      - COMMON_STORAGETYPE=local
    volumes:
      - ./embedEtcd.yaml:/milvus/configs/embedEtcd.yaml
      - ./milvus.yaml:/milvus/configs/milvus.yaml
    ports:
      - "19530:19530"
      - "9091:9091"
    healthcheck:
      test: ["CMD", "curl", "-f", "http://localhost:9091/healthz"]
      interval: 30s
      start_period: 90s
      timeout: 20s
      retries: 3
    security_opt:
      - seccomp:unconfined
    depends_on:
      - jaeger

# Jaeger - starts first since Milvus depends on it
  jaeger:
    image: jaegertracing/all-in-one:1.46.0
    ports:
      - "16686:16686"  # Jaeger UI
      - "4317:4317"    # OTLP gRPC receiver
      - "4318:4318"    # OTLP HTTP receiver
      - "5778:5778"    # Jaeger agent configs
      - "9411:9411"    # Zipkin compatible endpoint
    environment:
      - COLLECTOR_OTLP_ENABLED=true
Note: Example configuration files embedEtcd.yaml and milvus.yaml can be found at: https://github.com/topikachu/milvus-py-otel.
Milvus Tracing Configuration
Create configs/milvus.yaml with the tracing configuration:
# OpenTelemetry tracing configuration
trace:
  exporter: otlp           # Use OpenTelemetry Protocol
  sampleFraction: 1.0      # Trace 100% of requests (reduce for production)
  otlp:
    endpoint: jaeger:4317  # Jaeger's OTLP gRPC endpoint
    method: grpc          # Use gRPC protocol
    secure: false         # No TLS (use true in production)
    initTimeoutSeconds: 10
Configuration explained:
sampleFraction: 1.0traces every request (useful for development, but use 0.1 or lower in production)secure: falsedisables TLS (enable in production)endpoint: jaeger:4317uses Docker service name for internal communication
Starting the Services
docker-compose up -d
Verifying Trace Delivery from Milvus to Jaeger
Once the services are running, you can verify if trace data is emitted from the Milvus standalone and received by Jaeger.
Open your browser and visit Jaeger UI at:
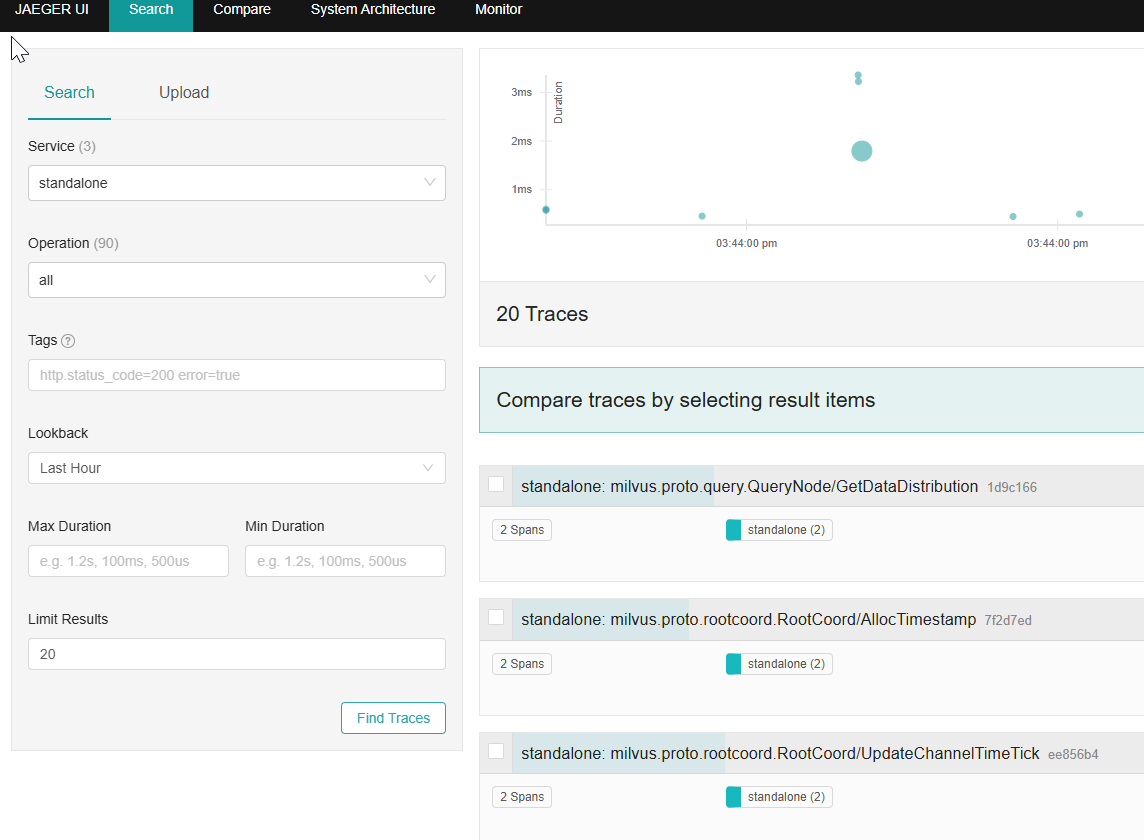
http://localhost:16686/searchIn the Search panel (top-left), choose the Service dropdown and select
standalone. If you seestandalonein the service list, it means Milvus’s built-in OpenTelemetry configuration is working and has successfully pushed trace data to Jaeger.Click Find Traces to explore trace chains generated by internal Milvus components (such as gRPC interactions between modules).
If Trace Data Is Not Showing:
Double-check that the
traceblock inmilvus.yamlis configured correctly and that Jaeger is running without issues.Inspect the Milvus container logs to see if there are any errors related to Trace initialization.
Wait a few seconds and refresh the Jaeger UI; trace reporting may experience a short delay.
Python Client Setup and Dependencies
Now let’s set up the Python client to trace all Milvus operations automatically.
First, create a requirements.txt file:
# OpenTelemetry core
opentelemetry-api==1.33.1
opentelemetry-sdk==1.33.1
# OTLP exporters
opentelemetry-exporter-otlp==1.33.1
opentelemetry-exporter-otlp-proto-grpc==1.33.1
# Automatic gRPC instrumentation
opentelemetry-instrumentation-grpc==0.54b1
# Milvus client
pymilvus==2.5.9
Then install dependencies via:
pip install -r requirements.txt
This ensures your Python environment is ready for tracing gRPC calls made to the Milvus backend.
Initializing OpenTelemetry in Python
Now, let’s configure tracing within your Python application. This snippet sets up OTEL with gRPC instrumentation and prepares a tracer.
import os
from opentelemetry import trace
from opentelemetry.sdk.resources import Resource
from opentelemetry.sdk.trace import TracerProvider
from opentelemetry.sdk.trace.export import BatchSpanProcessor
from opentelemetry.exporter.otlp.proto.grpc.trace_exporter import OTLPSpanExporter
from opentelemetry.instrumentation.grpc import GrpcInstrumentorClient

# Set OTEL environment variables (you can also load them from external configs)
os.environ['OTEL_EXPORTER_OTLP_ENDPOINT'] = 'http://localhost:4317'
os.environ['OTEL_SERVICE_NAME'] = 'milvus-client'

# Define service metadata
resource = Resource.create({
    "service.name": "milvus-client",
    "application": "milvus-otel-test"
})

# Initialize tracer and export processor
trace.set_tracer_provider(
    TracerProvider(resource=resource)
)
otlp_exporter = OTLPSpanExporter()
span_processor = BatchSpanProcessor(otlp_exporter)
trace.get_tracer_provider().add_span_processor(span_processor)

# Enable automatic instrumentation for gRPC clients
grpc_client_instrumentor = GrpcInstrumentorClient()
grpc_client_instrumentor.instrument()

# Acquire tracer
tracer = trace.get_tracer(__name__)
Here, GrpcInstrumentorClient() hooks into the underlying gRPC stack so you don’t need to manually modify client code for instrumentation. The OTLPSpanExporter() is configured to send trace data to your local Jaeger instance.
Complete Milvus Python Example with Tracing
Now let’s create a comprehensive example that demonstrates tracing with realistic Milvus operations:
from pymilvus import MilvusClient
from opentelemetry import trace

with tracer.start_as_current_span("test_milvus_otel"):
    milvus_client = MilvusClient(
        uri="http://localhost:19530",
    )
    collection_name = "quick_setup"

    # Drop collection if it exists
    if milvus_client.has_collection(collection_name):
        milvus_client.drop_collection(collection_name)

    # Create collection
    milvus_client.create_collection(
        collection_name=collection_name,
        dimension=5
    )

    # Add additional operations here

    milvus_client.close()
Viewing Trace Output
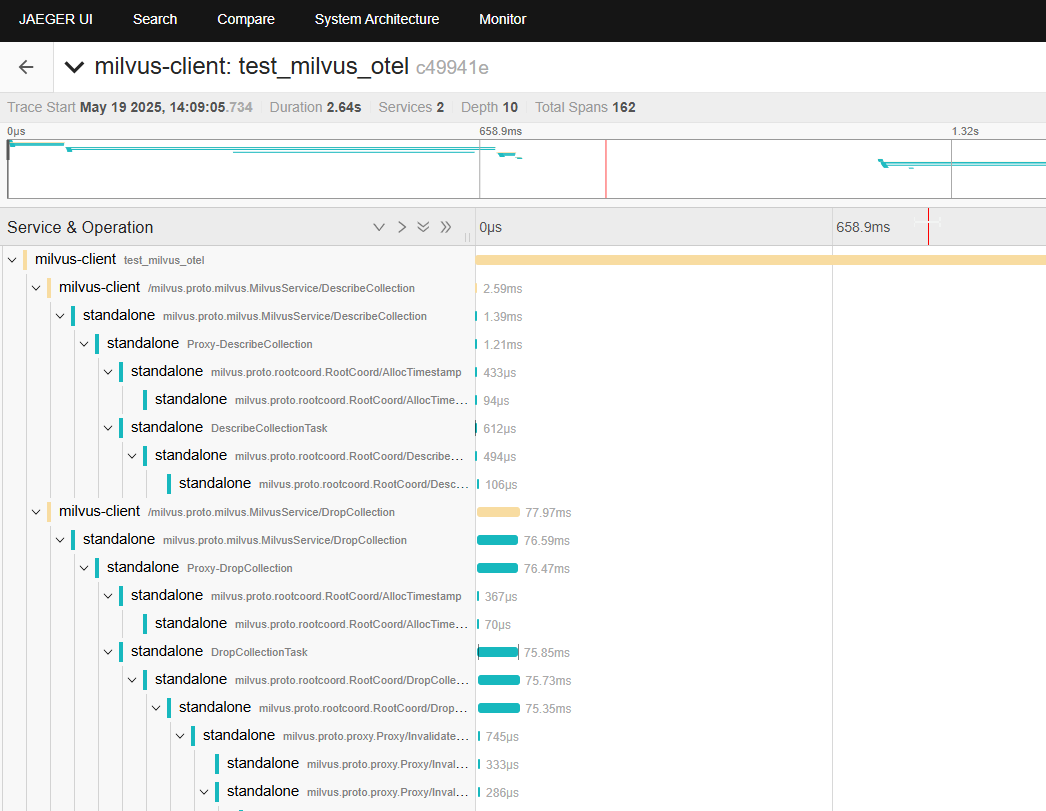
Once your Python client sends trace data, return to Jaeger: http://localhost:16686
Select the milvus-client service to view trace spans that correspond to your Python client’s Milvus operations. This makes it much easier to analyze performance and trace interactions across system boundaries.
Examples in Other Languages
Beyond Python, you can implement Milvus tracing in other languages:
👉Java: Use the OpenTelemetry Java Agent for zero-code instrumentation 👉Go: Leverage the OpenTelemetry Go SDK for native integration 👉Node.js: Auto-instrument gRPC calls with the JavaScript SDK
Each example follows similar patterns but uses language-specific OpenTelemetry libraries.
Summary
You’ve successfully implemented end-to-end tracing for Milvus operations! Here’s what you’ve accomplished:
✅ Infrastructure: Set up Milvus and Jaeger with proper networking
✅ Server-side tracing: Configured Milvus to export traces automatically
✅ Client-side tracing: Instrumented Python client with OpenTelemetry
✅ Visualization: Used Jaeger to analyze system performance
✅ Production readiness: Learned configuration best practices
All works without any changes to the Milvus SDK source code. Just a few configuration settings and your tracing pipeline is live—simple, effective, and ready for production.
You can take it further by integrating logs and metrics to build a complete monitoring solution for your AI-native vector database deployment.
Learn More
Milvus Documentation: https://milvus.io/docs
OpenTelemetry for Python: https://opentelemetry.io/docs/instrumentation/python/
Jaeger Documentation: https://www.jaegertracing.io/docs/
Milvus OpenTelemetry Integration Demo (Python): https://github.com/topikachu/milvus-py-otel
- Introduction
- What We'll Build
- Quick Start (5 Minutes)
- Environment Setup
- Setting Up Milvus and Jaeger
- Docker Compose Configuration
- Milvus Tracing Configuration
- Starting the Services
- Verifying Trace Delivery from Milvus to Jaeger
- If Trace Data Is Not Showing:
- Python Client Setup and Dependencies
- Initializing OpenTelemetry in Python
- Complete Milvus Python Example with Tracing
- Viewing Trace Output
- Examples in Other Languages
- Summary
- Learn More
On This Page
Try Managed Milvus for Free
Zilliz Cloud is hassle-free, powered by Milvus and 10x faster.
Get StartedLike the article? Spread the word