Configure Trace
This guide provides instructions on how to configure Jaeger to collect traces for Milvus.
Prerequisites
- You have installed necessary tools, including Helm and Kubectl.
- Cert-manager version 1.6.1 or higher must be installed. An installation guide can be found here.
Deply Jaeger
Jaeger is a distributed tracing platform released as open source by Uber Technologies.
1. Installing the Jaeger Operator on Kubernetes
To install the operator, run:
$ kubectl create namespace observability
$ kubectl create -f https://github.com/jaegertracing/jaeger-operator/releases/download/v1.62.0/jaeger-operator.yaml -n observability
At this point, there should be a jaeger-operator deployment available. You can view it by running the following command:
$ kubectl get deployment jaeger-operator -n observability

NAME              DESIRED   CURRENT   UP-TO-DATE   AVAILABLE   AGE
jaeger-operator   1         1         1            1           48s
2. Deploy Jaeger
The simplest possible way to create a Jaeger instance is by creating a YAML file like the following example. This will install the default AllInOne strategy, which deploys the all-in-one image (combining jaeger-agent, jaeger-collector, jaeger-query, and Jaeger UI) in a single pod, using in-memory storage by default.
If you want to store traces for a long time, please refer to production-strategy.
apiVersion: jaegertracing.io/v1
kind: Jaeger
metadata:
  name: jaeger
The YAML file can then be used with kubectl:
$ kubectl apply -f simplest.yaml
In a few seconds, a new in-memory all-in-one instance of Jaeger will be available, suitable for quick demos and development purposes. To check the instances that were created, list the jaeger objects:
$ kubectl get jaegers

NAME     STATUS    VERSION   STRATEGY   STORAGE   AGE
jaeger   Running   1.62.0    allinone   memory    13s
Install Milvus with Helm Chart
You can install or upgrade Milvus with Helm Chart with the following settings:
extraConfigFiles:
  user.yaml: |+
    trace:
      exporter: jaeger
      sampleFraction: 1
      jaeger:
        url: "http://jaeger-collector:14268/api/traces"
To apply the above settings to a new Milvus deployment , you can run the following command:
$ helm repo add zilliztech https://zilliztech.github.io/milvus-helm
$ helm repo update
$ helm upgrade --install -f values.yaml my-release milvus/milvus
To apply the above settings to an existing Milvus deployment, you can run the following command:
$ helm upgrade my-release -f values.yaml milvus/milvus
View Traces
Once you have deployed Jaeger and Milvus with Helm Chart, an ingress has been enabled by dfault. You can view the ingress by running the following command:
$ kubectl get ingress

NAME           CLASS    HOSTS   ADDRESS         PORTS   AGE
jaeger-query   <none>   *       192.168.122.34  80      14m
Once the ingress is available, you can access the Jaeger UI by navigating to http://${ADDRESS}. Replace ${ADDRESS} with the actual IP address of the ingress.
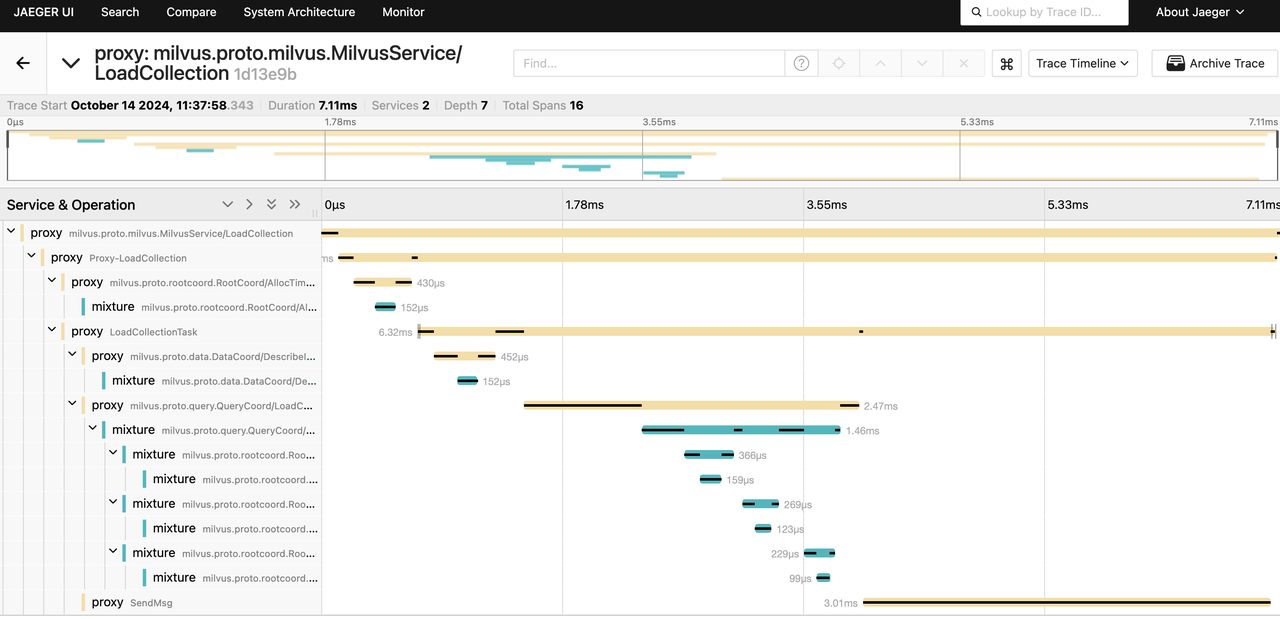
The following screenshot shows the Jaeger UI with the traces of Milvus during a search operation and a load-collection operation:
Trace Search Request
 Trace Load Collection Request