Dynamically Change Log Levels in the Milvus Vector Database
 Cover image
This article is written by Enwei Jiao and translated by Angela Ni.
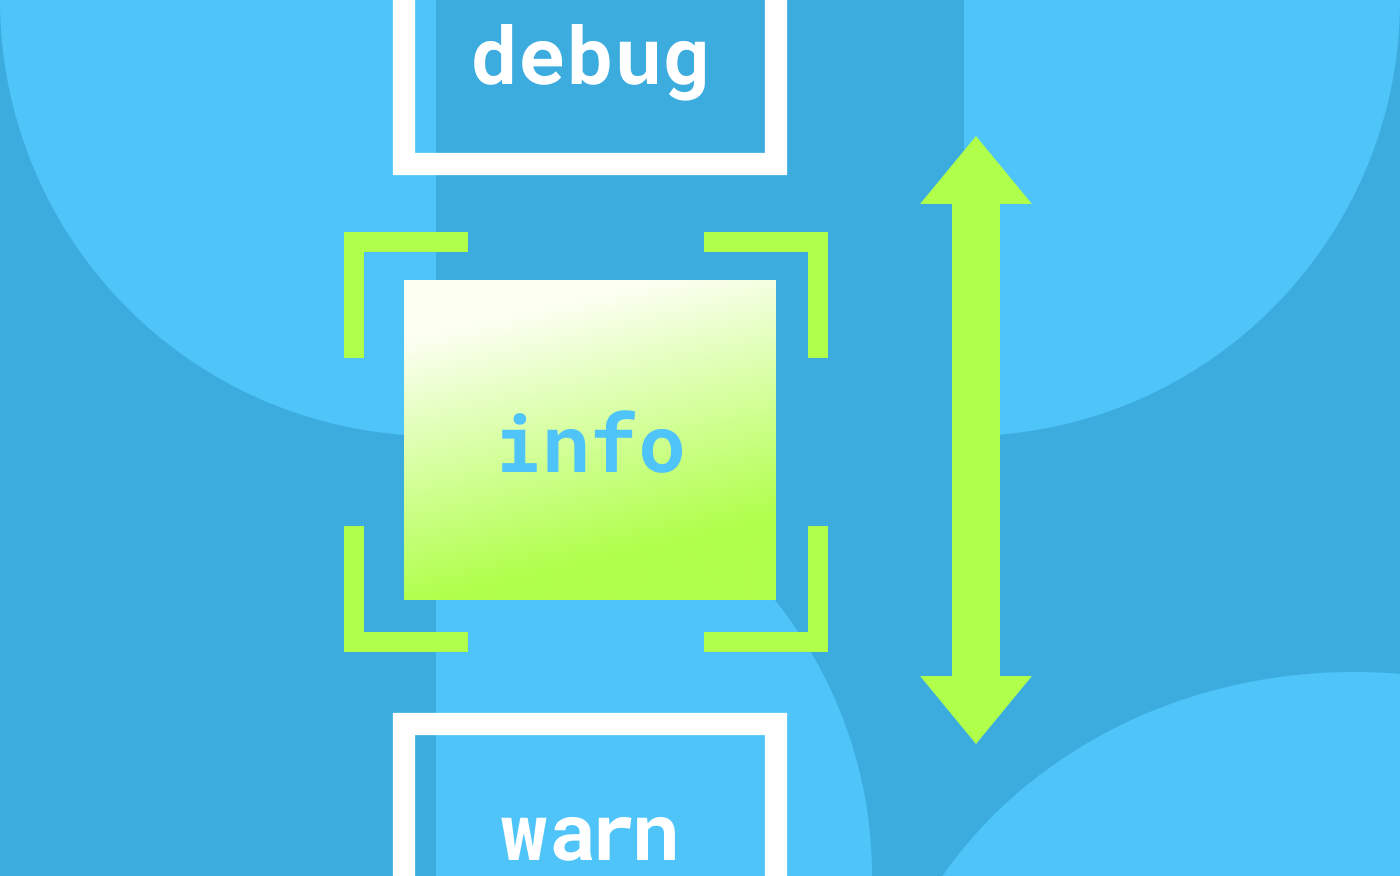
To prevent an over-output of logs from affecting disk and system performance, Milvus by default outputs logs at the info level while running. However, sometimes logs at the info level are not sufficient enough to help us efficiently identify bugs and issues. What’s worse, in some cases, changing the log level and restarting the service might lead to the failure of reproducing the issues, making troubleshooting all the more difficult. Consequently, the support for changing log levels dynamically in the Milvus vector database is urgently needed.
This article aims to introduce the mechanism behind that enables changing log levels dynamically and provide instructions on how to do so in the Milvus vector database.
Jump to:
Mechanism
The Milvus vector database adopts the zap logger open sourced by Uber. As one the most powerful log components in the Go language ecosystem, zap incorporates an http_handler.go module so that you can view the current log level and dynamically change the log level via an HTTP interface.
Milvus listens the HTTP service provided by the 9091 port. Therefore, you can access the 9091 port to take advantage such features as performance debugging, metrics, health checks. Similarly, the 9091 port is reused to enable dynamic log level modification and a /log/level path is also added to the port. See the log interface PR for more information.
How to dynamically change log levels
This section provides instructions on how to dynamically change log levels without the need the restarting the running Milvus service.
Prerequisite
Ensure that you can access the 9091 port of Milvus components.
Change the log level
Suppose the IP address of the Milvus proxy is 192.168.48.12.
You can first run $ curl -X GET 192.168.48.12:9091/log/level to check the current log level of the proxy.
Then you can make adjustments by specifying the log level. Log level options include:
debuginfowarnerrordpanicpanicfatal
The following example code changes the log level from the default log level from info to error.
$ curl -X PUT 192.168.48.12:9091/log/level -d level=error
- Mechanism
- How to dynamically change log levels
On This Page
Try Managed Milvus for Free
Zilliz Cloud is hassle-free, powered by Milvus and 10x faster.
Get StartedLike the article? Spread the word


