What If You Could See Why RAG Fails? Debugging RAG in 3D with Project_Golem and Milvus
When RAG retrieval goes wrong, you usually know that it’s broken — relevant documents don’t show up, or irrelevant ones do. But figuring out why is a different story. All you have to work with are similarity scores and a flat list of results. There’s no way to see how documents are actually positioned in the vector space, how chunks relate to each other, or where your query landed relative to the content it should have matched. In practice, this means RAG debugging is mostly trial and error: tweak the chunking strategy, swap the embedding model, adjust the top-k, and hope the results improve.
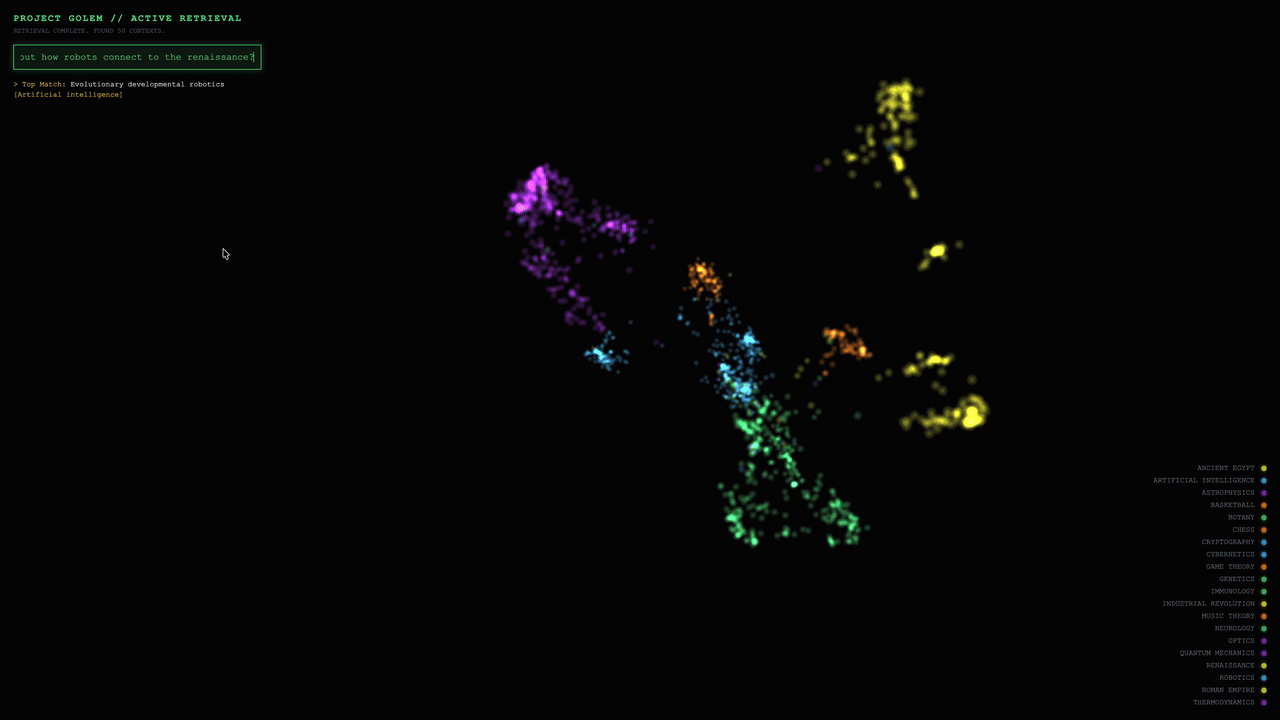
Project_Golem is an open-source tool that makes the vector space visible. It uses UMAP to project high-dimensional embeddings into 3D and Three.js to render them interactively in the browser. Instead of guessing why retrieval failed, you can see how chunks cluster semantically, where your query lands, and which documents were retrieved — all in a single visual interface.
This is amazing. However, the original Project_Golem was designed for small demos, not real-world systems. It relies on flat files, brute-force search, and full-dataset rebuilds — which means it breaks down quickly as your data grows beyond a few thousand documents.
To bridge that gap, we integrated Project_Golem with Milvus (specifically version 2.6.8) as its vector backbone. Milvus is an open-source high-performance vector database that handles real-time ingestion, scalable indexing, and millisecond-level retrieval, while Project_Golem stays focused on what it does best: making vector retrieval behavior visible. Together, they turn 3D visualization from a toy demo into a practical debugging tool for production RAG systems.
In this post, we’ll walk through Project_Golem and show how we integrated it with Milvus to make vector search behavior observable, scalable, and production-ready.
What Is Project_Golem?
RAG debugging is hard for a simple reason: vector spaces are high-dimensional, and humans can’t see them.
Project_Golem is a browser-based tool that lets you see the vector space your RAG system operates in. It takes the high-dimensional embeddings that drive retrieval — typically 768 or 1536 dimensions — and projects them into an interactive 3D scene you can explore directly.
Here’s how it works under the hood:
- Dimensionality reduction with UMAP. Project_Golem uses UMAP to compress high-dimensional vectors down to three dimensions while preserving their relative distances. Chunks that are semantically similar in the original space stay close together in the 3D projection; unrelated chunks end up far apart.
- 3D rendering with Three.js. Each document chunk appears as a node in a 3D scene rendered in the browser. You can rotate, zoom, and explore the space to see how your documents cluster — which topics group tightly, which ones overlap, and where the boundaries are.
- Query-time highlighting. When you run a query, retrieval still happens in the original high-dimensional space using cosine similarity. But once results come back, the retrieved chunks light up in the 3D view. You can immediately see where your query landed relative to the results — and just as importantly, relative to the documents it didn’t retrieve.
This is what makes Project_Golem useful for debugging. Instead of staring at a ranked list of results and guessing why a relevant document was missed, you can see whether it’s sitting in a distant cluster (an embedding issue), overlapping with irrelevant content (a chunking issue), or just barely outside the retrieval threshold (a configuration issue). The 3D view turns abstract similarity scores into spatial relationships you can reason about.
Why Project_Golem Isn’t Production-Ready
Project_Golem was designed as a visualization prototype, and it works well for that. But its architecture makes assumptions that break down quickly at scale — in ways that matter if you want to use it for real-world RAG debugging.
Every Update Requires a Full Rebuild
This is the most fundamental limitation. In the original design, adding new documents triggers a complete pipeline rebuild: embeddings are regenerated and written to .npy files, UMAP is rerun across the entire dataset, and 3D coordinates are re-exported as JSON.
Even at 100,000 documents, a single-core UMAP run takes 5–10 minutes. At the million-document scale, it becomes impractical entirely. You can’t use this for any dataset that changes continuously — news feeds, documentation, user conversations — because every update means waiting for a full reprocessing cycle.
Brute-Force Search Doesn’t Scale
The retrieval side has its own ceiling. The original implementation uses NumPy for brute-force cosine similarity search — linear time complexity, no indexing. On a million-document dataset, a single query can take over a second. That’s unusable for any interactive or online system.
Memory pressure compounds the problem. Each 768-dimensional float32 vector takes roughly 3 KB, so a million-vector dataset requires over 3 GB in memory — all loaded into a flat NumPy array with no index structure to make search efficient.
No Metadata Filtering, No Multi-Tenancy
In a real RAG system, vector similarity is rarely the only retrieval criterion. You almost always need to filter by metadata, such as document type, timestamps, user permissions, or application-level boundaries. A customer support RAG system, for example, needs to scope retrieval to a specific tenant’s documents — not search across everyone’s data.
Project_Golem supports none of this. There are no ANN indexes (like HNSW or IVF), no scalar filtering, no tenant isolation, and no hybrid search. It’s a visualization layer without a production retrieval engine underneath.
How Milvus Powers Project_Golem’s Retrieval Layer
The previous section identified three gaps: full rebuilds on every update, brute-force search, and no metadata-aware retrieval. All three stem from the same root cause — Project_Golem has no database layer. Retrieval, storage, and visualization are tangled into a single pipeline, so changing any part forces a rebuild of everything.
The fix isn’t to optimize that pipeline. It’s to split it apart.
By integrating Milvus 2.6.8 as the vector backbone, retrieval becomes a dedicated, production-grade layer that operates independently from visualization. Milvus handles vector storage, indexing, and search. Project_Golem focuses purely on rendering — consuming document IDs from Milvus and highlighting them in the 3D view.
This separation produces two clean, independent flows:
Retrieval Flow (Online, Millisecond-Level)
- Your query is converted into a vector using OpenAI embeddings.
- The query vector is sent to a Milvus collection.
- Milvus AUTOINDEX selects and optimizes the appropriate index.
- A real-time cosine similarity search returns the relevant document IDs.
Visualization Flow (Offline, Demo-Scale)
- UMAP generates 3D coordinates during data ingestion (n_neighbors=30, min_dist=0.1).
- The coordinates are stored in golem_cortex.json.
- The frontend highlights the corresponding 3D nodes using the document IDs returned by Milvus.
The critical point: retrieval no longer waits on visualization. You can ingest new documents and search them immediately — the 3D view catches up on its own schedule.
What Streaming Nodes Change
This real-time ingestion is powered by a new capability in Milvus 2.6.8: Streaming Nodes. In earlier versions, real-time ingestion required an external message queue like Kafka or Pulsar. Streaming Nodes move that coordination into Milvus itself — new vectors are ingested continuously, indexes are updated incrementally, and newly added documents become searchable immediately with no full rebuild and no external dependencies.
For Project_Golem, this is what makes the architecture practical. You can keep adding documents to your RAG system — new articles, updated docs, user-generated content — and retrieval stays current without triggering the expensive UMAP → JSON → reload cycle.
Extending Visualization to Million-Scale (Future Path)
With this Milvus-backed setup, Project_Golem currently supports interactive demos at around 10,000 documents. Retrieval scales well beyond that — Milvus handles millions — but the visualization pipeline still relies on batch UMAP runs. To close that gap, the architecture can be extended with an incremental visualization pipeline:
Update triggers: The system listens for insert events on the Milvus collection. Once newly added documents reach a defined threshold (for example, 1,000 items), an incremental update is triggered.
Incremental projection: Instead of rerunning UMAP across the full dataset, new vectors are projected into the existing 3D space using UMAP’s transform() method. This preserves global structure while dramatically reducing computation cost.
Frontend synchronization: Updated coordinate fragments are streamed to the frontend via WebSocket, allowing new nodes to appear dynamically without reloading the entire scene.
Beyond scalability, Milvus 2.6.8 enables hybrid search by combining vector similarity with full-text search and scalar filtering. This opens the door to richer 3D interactions—such as keyword highlighting, category filtering, and time-based slicing—giving developers more powerful ways to explore, debug, and reason about RAG behavior.
How to Deploy and Explore Project_Golem with Milvus
The upgraded Project_Golem is now open source on GitHub. Using the Milvus official documentation as our dataset, we walk through the full process of visualizing RAG retrieval in 3D. The setup uses Docker and Python and is easy to follow, even if you’re starting from scratch.
Prerequisites
- Docker ≥ 20.10
- Docker Compose ≥ 2.0
- Python ≥ 3.11
- An OpenAI API key
- A dataset (Milvus documentation in Markdown format)
1. Deploy Milvus
Download docker-compose.yml
wget https://github.com/milvus-io/milvus/releases/download/v2.6.8/milvus-standalone-docker-compose.yml -O docker-compose.yml
Start Milvus(verify port mapping:19530:19530)
docker-compose up -d
Verify that the services are running
docker ps | grep milvus
You should see three containers:milvus-standalone, milvus-etcd, milvus-minio
2. Core Implementation
Milvus Integration (ingest.py)
Note: The implementation supports up to eight document categories. If the number of categories exceeds this limit, colors are reused in a round-robin fashion.
from pymilvus import MilvusClient
from pymilvus.milvus_client.index import IndexParams
from openai import OpenAI
from langchain_text_splitters import RecursiveCharacterTextSplitter
import umap
from sklearn.neighbors import NearestNeighbors
import json
import numpy as np
import os
import glob
--- CONFIG ---
MILVUS_URI = "http://localhost:19530"
COLLECTION_NAME = "golem_memories"
JSON_OUTPUT_PATH = "./golem_cortex.json"
Data directory (users place .md files in this folder)
DATA_DIR = "./data"
OpenAI Embedding Config
OPENAI_API_KEY = os.getenv("OPENAI_API_KEY")
OPENAI_BASE_URL = "https://api.openai.com/v1"  #
OPENAI_EMBEDDING_MODEL = "text-embedding-3-small"
1536 dimensions
EMBEDDING_DIM = 1536
Color mapping: colors are assigned automatically and reused in a round-robin manner
COLORS = [
[0.29, 0.87, 0.50],
Green
[0.22, 0.74, 0.97],
Blue
[0.60, 0.20, 0.80],
Purple
[0.94, 0.94, 0.20],
Gold
[0.98, 0.55, 0.00],
Orange
[0.90, 0.30, 0.40],
Red
[0.40, 0.90, 0.90],
Cyan
[0.95, 0.50, 0.90],
Magenta
]
def get_embeddings(texts):
"""Batch embedding using OpenAI API"""
client = OpenAI(api_key=OPENAI_API_KEY, base_url=OPENAI_BASE_URL)
embeddings = []
batch_size = 100
OpenAI allows multiple texts per request
for i in range(0, len(texts), batch_size):
batch = texts[i:i + batch_size]
response = client.embeddings.create(
model=OPENAI_EMBEDDING_MODEL,
input=batch
)
embeddings.extend([item.embedding for item in response.data])
print(f"   ↳ Embedded {min(i + batch_size, len(texts))}/{len(texts)}...")
return np.array(embeddings)
def load_markdown_files(data_dir):
"""Load all markdown files from the data directory"""
md_files = glob.glob(os.path.join(data_dir, "**/*.md"), recursive=True)
if not md_files:
print(f"   ❌ ERROR: No .md files found in '{data_dir}'")
print(f"   👉 Create a '{data_dir}' folder and put your markdown files there.")
print(f"   👉 Example: {data_dir}/doc1.md, {data_dir}/docs/doc2.md")
return None
docs = []
print(f"\n📚 FOUND {len(md_files)} MARKDOWN FILES:")
for i, file_path in enumerate(md_files):
filename = os.path.basename(file_path)
Categories are derived from the file’s path relative to data_dir
rel_path = os.path.relpath(file_path, data_dir)
category = os.path.dirname(rel_path) if os.path.dirname(rel_path) else "default"
with open(file_path, 'r', encoding='utf-8') as f:
content = f.read()
docs.append({
"title": filename,
"text": content,
"cat": category,
"path": file_path
})
print(f"   {i+1}. [{category}] {filename}")
return docs
def ingest_dense():
print(f"🧠 PROJECT GOLEM - NEURAL MEMORY BUILDER")
print(f"=" * 50)
if not OPENAI_API_KEY:
print("   ❌ ERROR: OPENAI_API_KEY environment variable not set!")
print("   👉 Run: export OPENAI_API_KEY='your-key-here'")
return
print(f"   ↳ Using OpenAI Embedding: {OPENAI_EMBEDDING_MODEL}")
print(f"   ↳ Embedding Dimension: {EMBEDDING_DIM}")
print(f"   ↳ Data Directory: {DATA_DIR}")
1. Load local markdown files
docs = load_markdown_files(DATA_DIR)
if docs is None:
return
2. Split documents into chunks
print(f"\n📦 PROCESSING DOCUMENTS...")
splitter = RecursiveCharacterTextSplitter(chunk_size=800, chunk_overlap=50)
chunks = []
raw_texts = []
colors = []
chunk_titles = []
categories = []
for doc in docs:
doc_chunks = splitter.create_documents([doc['text']])
cat_index = hash(doc['cat']) % len(COLORS)
for i, chunk in enumerate(doc_chunks):
chunks.append({
"text": chunk.page_content,
"title": doc['title'],
"cat": doc['cat']
})
raw_texts.append(chunk.page_content)
colors.append(COLORS[cat_index])
chunk_titles.append(f"{doc['title']} (chunk {i+1})")
categories.append(doc['cat'])
print(f"   ↳ Created {len(chunks)} text chunks from {len(docs)} documents")
3. Generate embeddings
print(f"\n🔮 GENERATING EMBEDDINGS...")
vectors = get_embeddings(raw_texts)
4. 3D Projection (UMAP)
print("\n🎨 CALCULATING 3D MANIFOLD...")
reducer = umap.UMAP(n_components=3, n_neighbors=30, min_dist=0.1, metric='cosine')
embeddings_3d = reducer.fit_transform(vectors)
5. Wiring (KNN)
print("   ↳ Wiring Synapses (finding connections)...")
nbrs = NearestNeighbors(n_neighbors=8, metric='cosine').fit(vectors)
distances, indices = nbrs.kneighbors(vectors)
6. Prepare output data
cortex_data = []
milvus_data = []
for i in range(len(chunks)):
cortex_data.append({
"id": i,
"title": chunk_titles[i],
"cat": categories[i],
"pos": embeddings_3d[i].tolist(),
"col": colors[i],
"nbs": indices[i][1:].tolist()
})
milvus_data.append({
"id": i,
"text": chunks[i]['text'],
"title": chunk_titles[i],
"category": categories[i],
"vector": vectors[i].tolist()
})
with open(JSON_OUTPUT_PATH, 'w') as f:
json.dump(cortex_data, f)
7. Store vectors in Milvus
print("\n💾 STORING IN MILVUS...")
client = MilvusClient(uri=MILVUS_URI)
Drop existing collection if it exists
if client.has_collection(COLLECTION_NAME):
print(f"   ↳ Dropping existing collection '{COLLECTION_NAME}'...")
client.drop_collection(COLLECTION_NAME)
Create new collection
print(f"   ↳ Creating collection '{COLLECTION_NAME}' (dim={EMBEDDING_DIM})...")
client.create_collection(
collection_name=COLLECTION_NAME,
dimension=EMBEDDING_DIM
)
Insert data
print(f"   ↳ Inserting {len(milvus_data)} vectors...")
client.insert(
collection_name=COLLECTION_NAME,
data=milvus_data
)
Create index for faster search
print("   ↳ Creating index...")
index_params = IndexParams()
index_params.add_index(
field_name="vector",
index_type="AUTOINDEX",
metric_type="COSINE"
)
client.create_index(
collection_name=COLLECTION_NAME,
index_params=index_params
)
print(f"\n✅ CORTEX GENERATED SUCCESSFULLY!")
print(f"   📊 {len(chunks)} memory nodes stored in Milvus")
print(f"   📁 Cortex data saved to: {JSON_OUTPUT_PATH}")
print(f"   🚀 Run 'python GolemServer.py' to start the server")
if __name__ == "__main__":
ingest_dense()
Frontend Visualization (GolemServer.py)
from flask import Flask, request, jsonify, send_from_directory
from openai import OpenAI
from pymilvus import MilvusClient
import json
import os
import sys
--- CONFIG ---
Explicitly set the folder to where this script is located
BASE_DIR = os.path.dirname(os.path.abspath(__file__))
OpenAI Embedding Config
OPENAI_API_KEY = os.getenv("OPENAI_API_KEY")
OPENAI_BASE_URL = "https://api.openai.com/v1"
OPENAI_EMBEDDING_MODEL = "text-embedding-3-small"
Milvus Config
MILVUS_URI = "http://localhost:19530"
COLLECTION_NAME = "golem_memories"
These match the files generated by ingest.py
JSON_FILE = "golem_cortex.json"
UPDATED: Matches your new repo filename
HTML_FILE = "index.html"
app = Flask(__name__, static_folder=BASE_DIR)
print(f"\n🧠 PROJECT GOLEM SERVER")
print(f"   📂 Serving from: {BASE_DIR}")
--- DIAGNOSTICS ---
Check if files exist before starting
missing_files = []
if not os.path.exists(os.path.join(BASE_DIR, JSON_FILE)):
missing_files.append(JSON_FILE)
if not os.path.exists(os.path.join(BASE_DIR, HTML_FILE)):
missing_files.append(HTML_FILE)
if missing_files:
print(f"   ❌ CRITICAL ERROR: Missing files in this folder:")
for f in missing_files:
print(f"      - {f}")
print("   👉 Did you run 'python ingest.py' successfully?")
sys.exit(1)
else:
print(f"   ✅ Files Verified: Cortex Map found.")
Check API Key
if not OPENAI_API_KEY:
print(f"   ❌ CRITICAL ERROR: OPENAI_API_KEY environment variable not set!")
print("   👉 Run: export OPENAI_API_KEY='your-key-here'")
sys.exit(1)
print(f"   ↳ Using OpenAI Embedding: {OPENAI_EMBEDDING_MODEL}")
print("   ↳ Connecting to Milvus...")
milvus_client = MilvusClient(uri=MILVUS_URI)
Verify collection exists
if not milvus_client.has_collection(COLLECTION_NAME):
print(f"   ❌ CRITICAL ERROR: Collection '{COLLECTION_NAME}' not found in Milvus.")
print("   👉 Did you run 'python ingest.py' successfully?")
sys.exit(1)
Initialize OpenAI client
openai_client = OpenAI(api_key=OPENAI_API_KEY, base_url=OPENAI_BASE_URL)
--- ROUTES ---
@app.route('/')
def root():
Force serve the specific HTML file
return send_from_directory(BASE_DIR, HTML_FILE)
@app.route('/')
def serve_static(filename):
return send_from_directory(BASE_DIR, filename)
@app.route('/query', methods=['POST'])
def query_brain():
data = request.json
text = data.get('query', '')
if not text: return jsonify({"indices": []})
print(f"🔎 Query: {text}")
Get query embedding from OpenAI
response = openai_client.embeddings.create(
model=OPENAI_EMBEDDING_MODEL,
input=text
)
query_vec = response.data[0].embedding
Search in Milvus
results = milvus_client.search(
collection_name=COLLECTION_NAME,
data=[query_vec],
limit=50,
output_fields=["id"]
)
Extract indices and scores
indices = [r['id'] for r in results[0]]
scores = [r['distance'] for r in results[0]]
return jsonify({
"indices": indices,
"scores": scores
})
if __name__ == '__main__':
print("   ✅ SYSTEM ONLINE: http://localhost:8000")
app.run(port=8000)
Download the dataset and place it in the specified directory
https://github.com/milvus-io/milvus-docs/tree/v2.6.x/site/en
3. Start the project
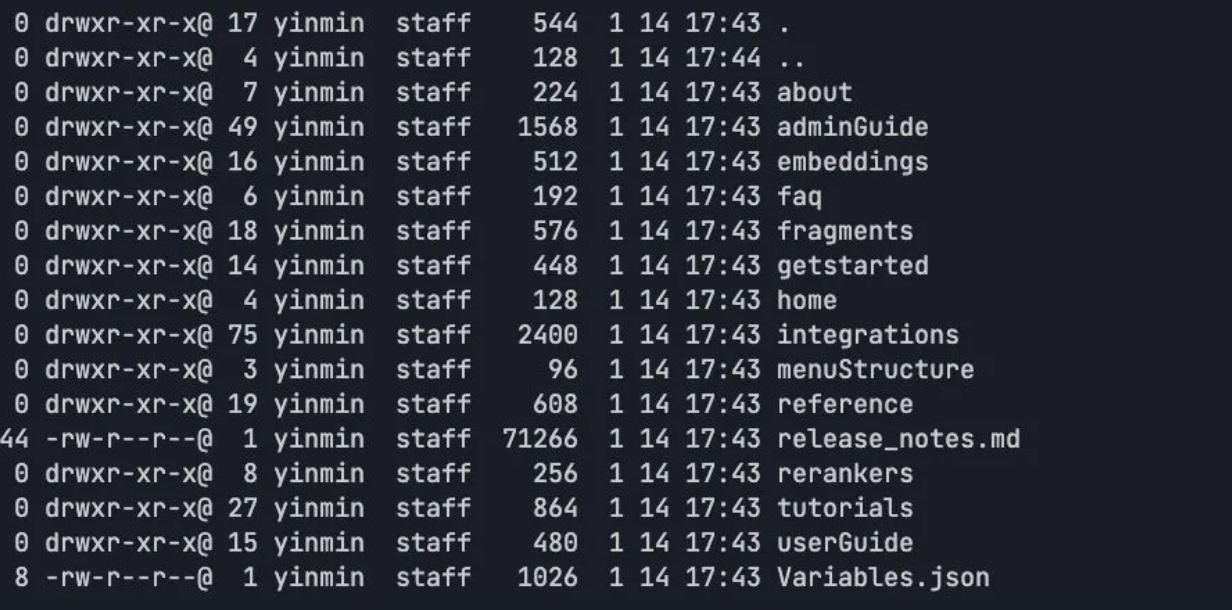
Converting text embeddings into 3D space
python ingest.py
[image]
Start the Frontend Service
python GolemServer.py
4. Visualization and Interaction
After the frontend receives the retrieval results, node brightness is scaled based on cosine similarity scores, while the original node colors are preserved to maintain clear category clusters. Semi-transparent lines are drawn from the query point to each matched node, and the camera smoothly pans and zooms to focus on the activated cluster.
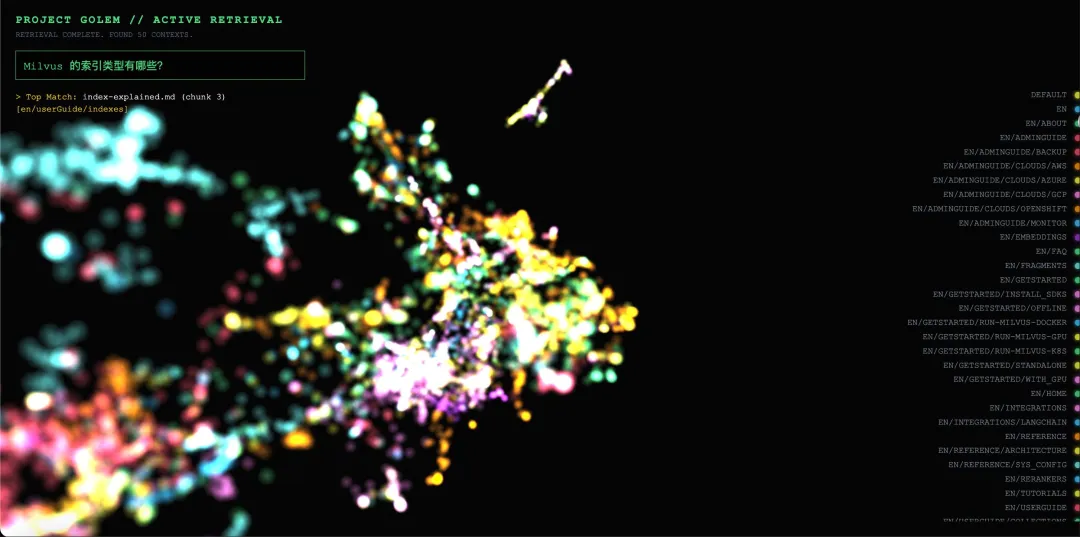
Example 1: In-Domain Match
Query: “Which index types does Milvus support?”
Visualization behavior:
In the 3D space, approximately 15 nodes within the red cluster labeled INDEXES show a noticeable increase in brightness (about 2–3×).
Matched nodes include chunks from documents such as index_types.md, hnsw_index.md, and ivf_index.md.
Semi-transparent lines are rendered from the query vector to each matched node, and the camera smoothly focuses on the red cluster.
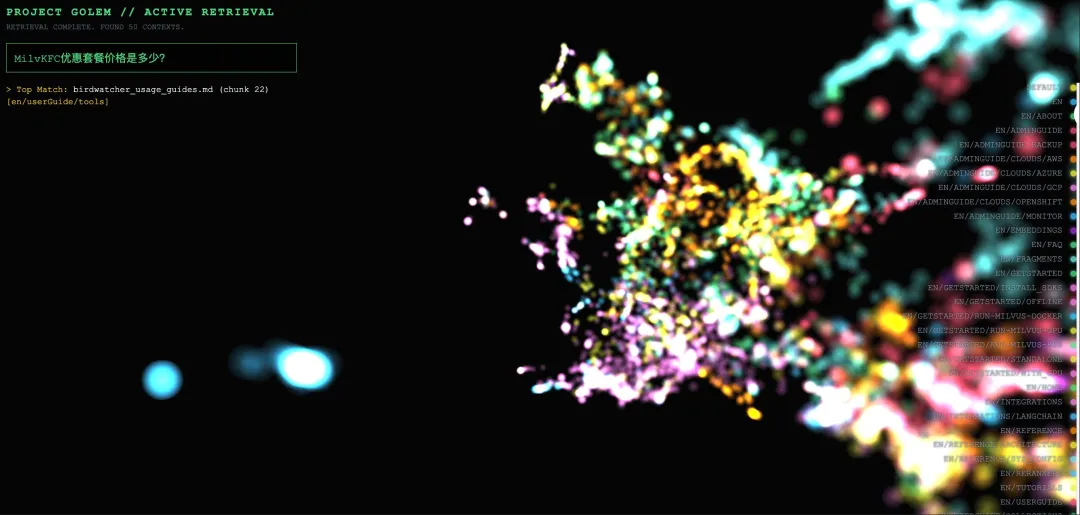
Example 2: Out-of-Domain Query Rejection
Query: “How much is the KFC value meal?”
Visualization behavior:
All nodes retain their original colors, with only slight size changes (less than 1.1×).
Matched nodes are scattered across multiple clusters with different colors, showing no clear semantic concentration.
The camera does not trigger a focus action, as the similarity threshold (0.5) is not met.
Conclusion
Project_Golem paired with Milvus won’t replace your existing RAG evaluation pipeline — but it adds something most pipelines lack entirely: the ability to see what’s happening inside the vector space.
With this setup, you can tell the difference between a retrieval failure caused by a bad embedding, one caused by poor chunking, and one caused by a threshold that’s just slightly too tight. That kind of diagnosis used to require guessing and iterating. Now you can see it.
The current integration supports interactive debugging at demo scale (~10,000 documents), with Milvus vector database handling production-grade retrieval behind the scenes. The path to million-scale visualization is mapped out but not yet built — which makes this a good time to get involved.
Check out Project_Golem on GitHub, try it with your own dataset, and see what your vector space actually looks like.
If you have questions or want to share what you find, join our Slack Channel, or book a Milvus Office Hours session for hands-on guidance on your setup.
- What Is Project_Golem?
- Why Project_Golem Isn't Production-Ready
- Every Update Requires a Full Rebuild
- Brute-Force Search Doesn't Scale
- No Metadata Filtering, No Multi-Tenancy
- How Milvus Powers Project_Golem’s Retrieval Layer
- What Streaming Nodes Change
- Extending Visualization to Million-Scale (Future Path)
- How to Deploy and Explore Project_Golem with Milvus
- Prerequisites
- 1. Deploy Milvus
- 2. Core Implementation
- 3. Start the project
- 4. Visualization and Interaction
- Conclusion
On This Page
Try Managed Milvus for Free
Zilliz Cloud is hassle-free, powered by Milvus and 10x faster.
Get StartedLike the article? Spread the word