Monitoring
Milvus-CDC provides comprehensive monitoring capabilities through Grafana dashboards, allowing you to visualize key metrics and ensure the smooth operation of your Change Data Capture (CDC) tasks and server health.
Metrics for CDC tasks
To get started, import the cdc-grafana.json file into Grafana. This will add a dashboard specifically designed for monitoring the status of CDC tasks.
CDC Grafana Dashboard Overview:
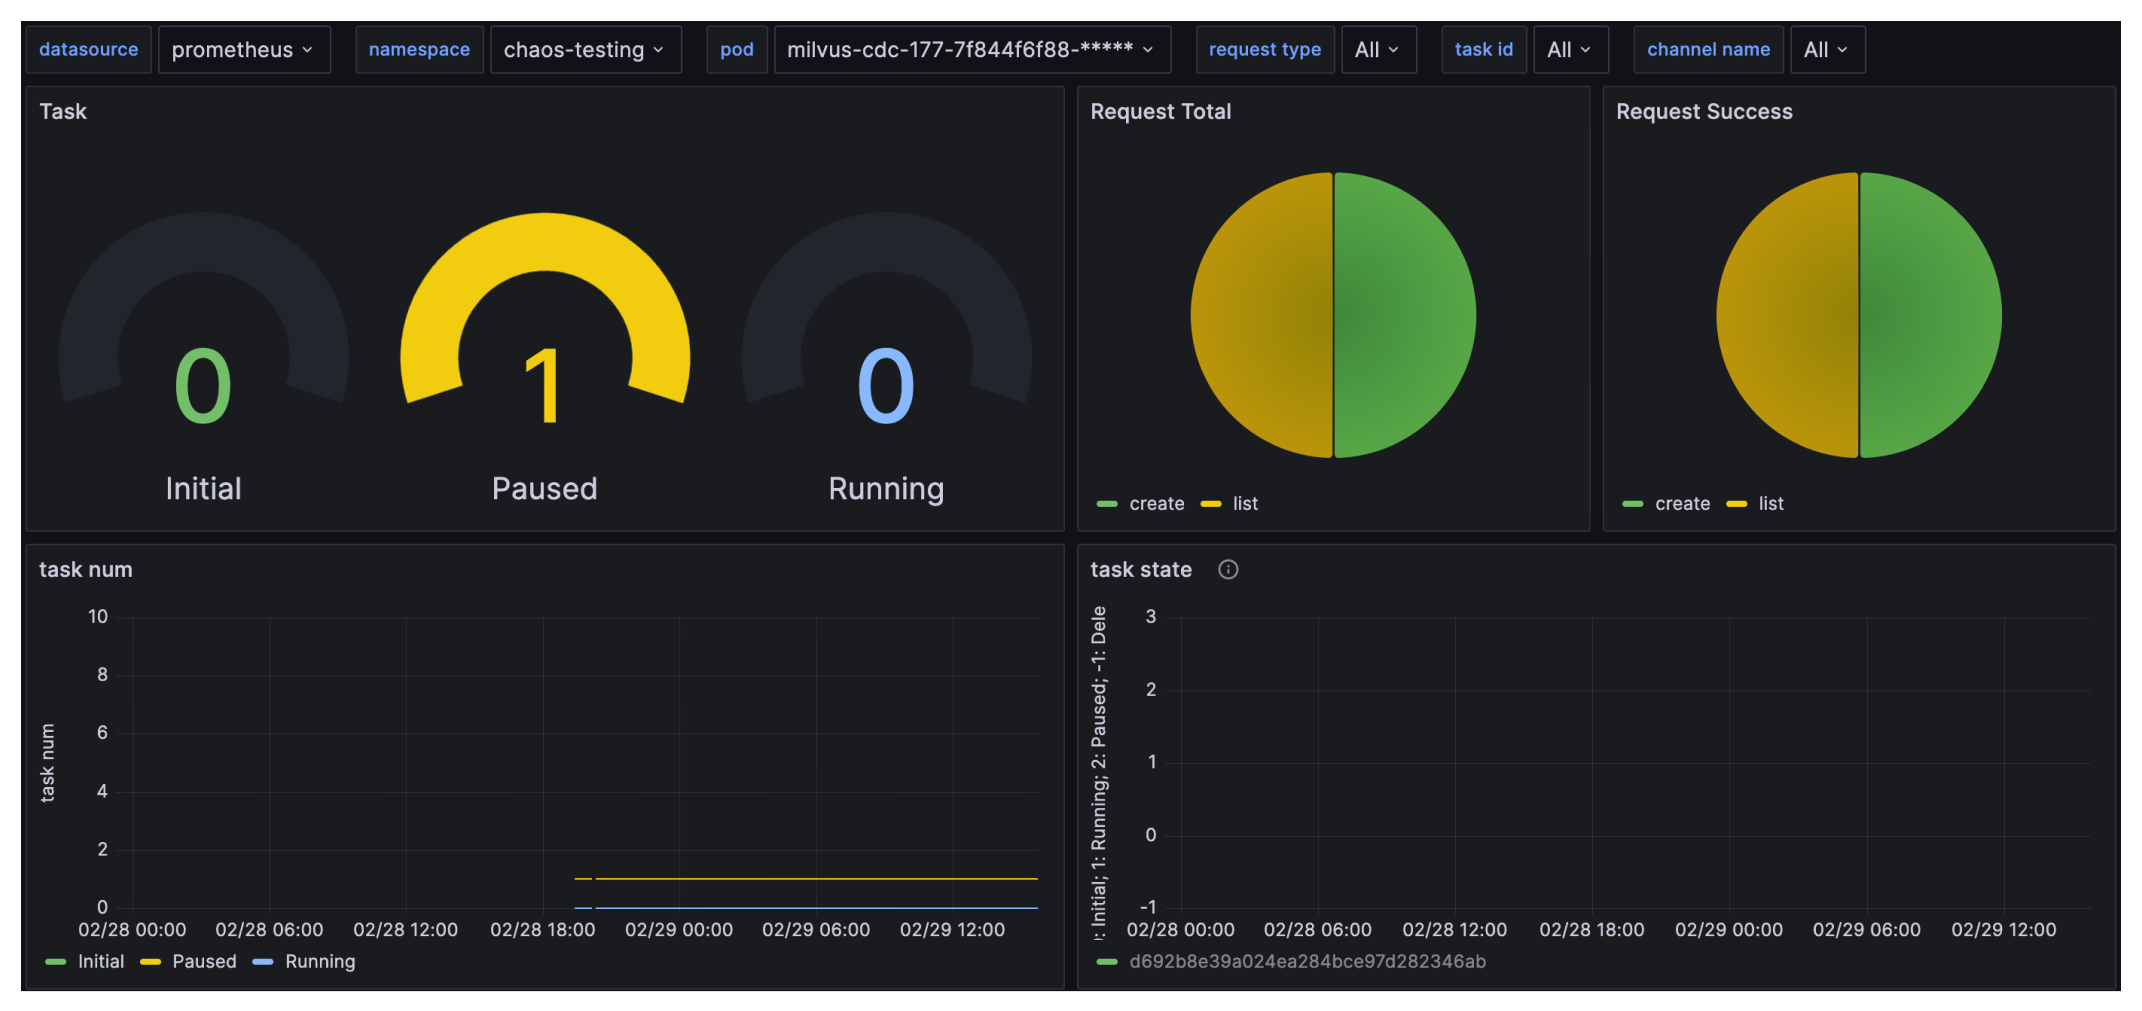 milvus-cdc-dashboard
Key Metrics Explained:
Task: Number of CDC tasks in different states, including Initial, Running, and Paused.
Request Total: Total number of requests received by Milvus-CDC.
Request Success: Number of successful requests received by Milvus-CDC.
task num: Number of tasks in Initial, Paused, and Running states over time.
task state: State of individual tasks.
request count: Number of successful and total requests
request latency: Latency of requests through p99, average and other statistics.
replicate data rate: Replication data rate for read/write operations
replicate tt lag: Replication time lag for read/write operations.
api execute count: Number of times different Milvus-CDC APIs were executed.
center ts: Timestamp for read/write tasks.