Attu 3.0 Beta: Multi-Cluster Management, AI Agent, and a Rebuilt Milvus Console
Attu 3.0 Beta is now available.
Attu is the open-source management console for Milvus. If you have used Milvus locally or in production, you have probably used Attu to inspect collections, browse data, manage schemas, or check what is happening inside a cluster.
Attu 2.x worked well for basic single-cluster management. But as Milvus deployments grew, its limits became more visible. It could only connect to one Milvus instance at a time. Connection state was lost after a container restart. Data browsing was mostly collection-centric. Diagnostics, monitoring, API debugging, backup and restore, and permission management often required separate tools or manual steps.
Attu 3.0 Beta is a full rebuild of the Milvus management experience.
This release adds multi-cluster management, persistent local state, a built-in AI Agent with 50+ Milvus tools, expert diagnostic skills, a redesigned data browser, built-in Prometheus metrics, an API Playground, GUI-based backup and restore, and simplified RBAC workflows.
In short, Attu is no longer just a lightweight viewer for one Milvus instance. It is becoming a practical operations console for developers and teams managing Milvus across local, staging, and production environments.
What Changed in Attu 3.0 Beta
Here is the high-level comparison between Attu 2.x and Attu 3.0 Beta.
| Feature | Attu 2.x | Attu 3.0 Beta |
|---|---|---|
| Cluster connections | Single instance only | Multiple clusters with one-click switching |
| State persistence | Stateless; lost on container restart | Local database; survives restarts |
| AI assistance | None | Built-in Agent with 50+ Milvus tools |
| Diagnostics | Manual investigation | 4 built-in expert-level diagnostic skills |
| RBAC management | Separate pages, multi-step flow | In-context, one-click user creation |
| Data navigation | Flat collection list | Hierarchical tree: database → collection → partition |
| Monitoring | External Grafana required | Built-in Prometheus metrics dashboard |
| API debugging | External tools such as curl or Postman | Built-in REST API Playground |
| Backup and restore | CLI only | GUI with S3, MinIO, GCS, and Azure support |
| LLM integration | None | BYOL: OpenAI, Anthropic, DeepSeek, Gemini, and more |
Manage Multiple Milvus Clusters From One Sidebar
The biggest day-to-day change is multi-cluster management. Attu 3.0 can connect to every Milvus instance you run and list them in a single sidebar.
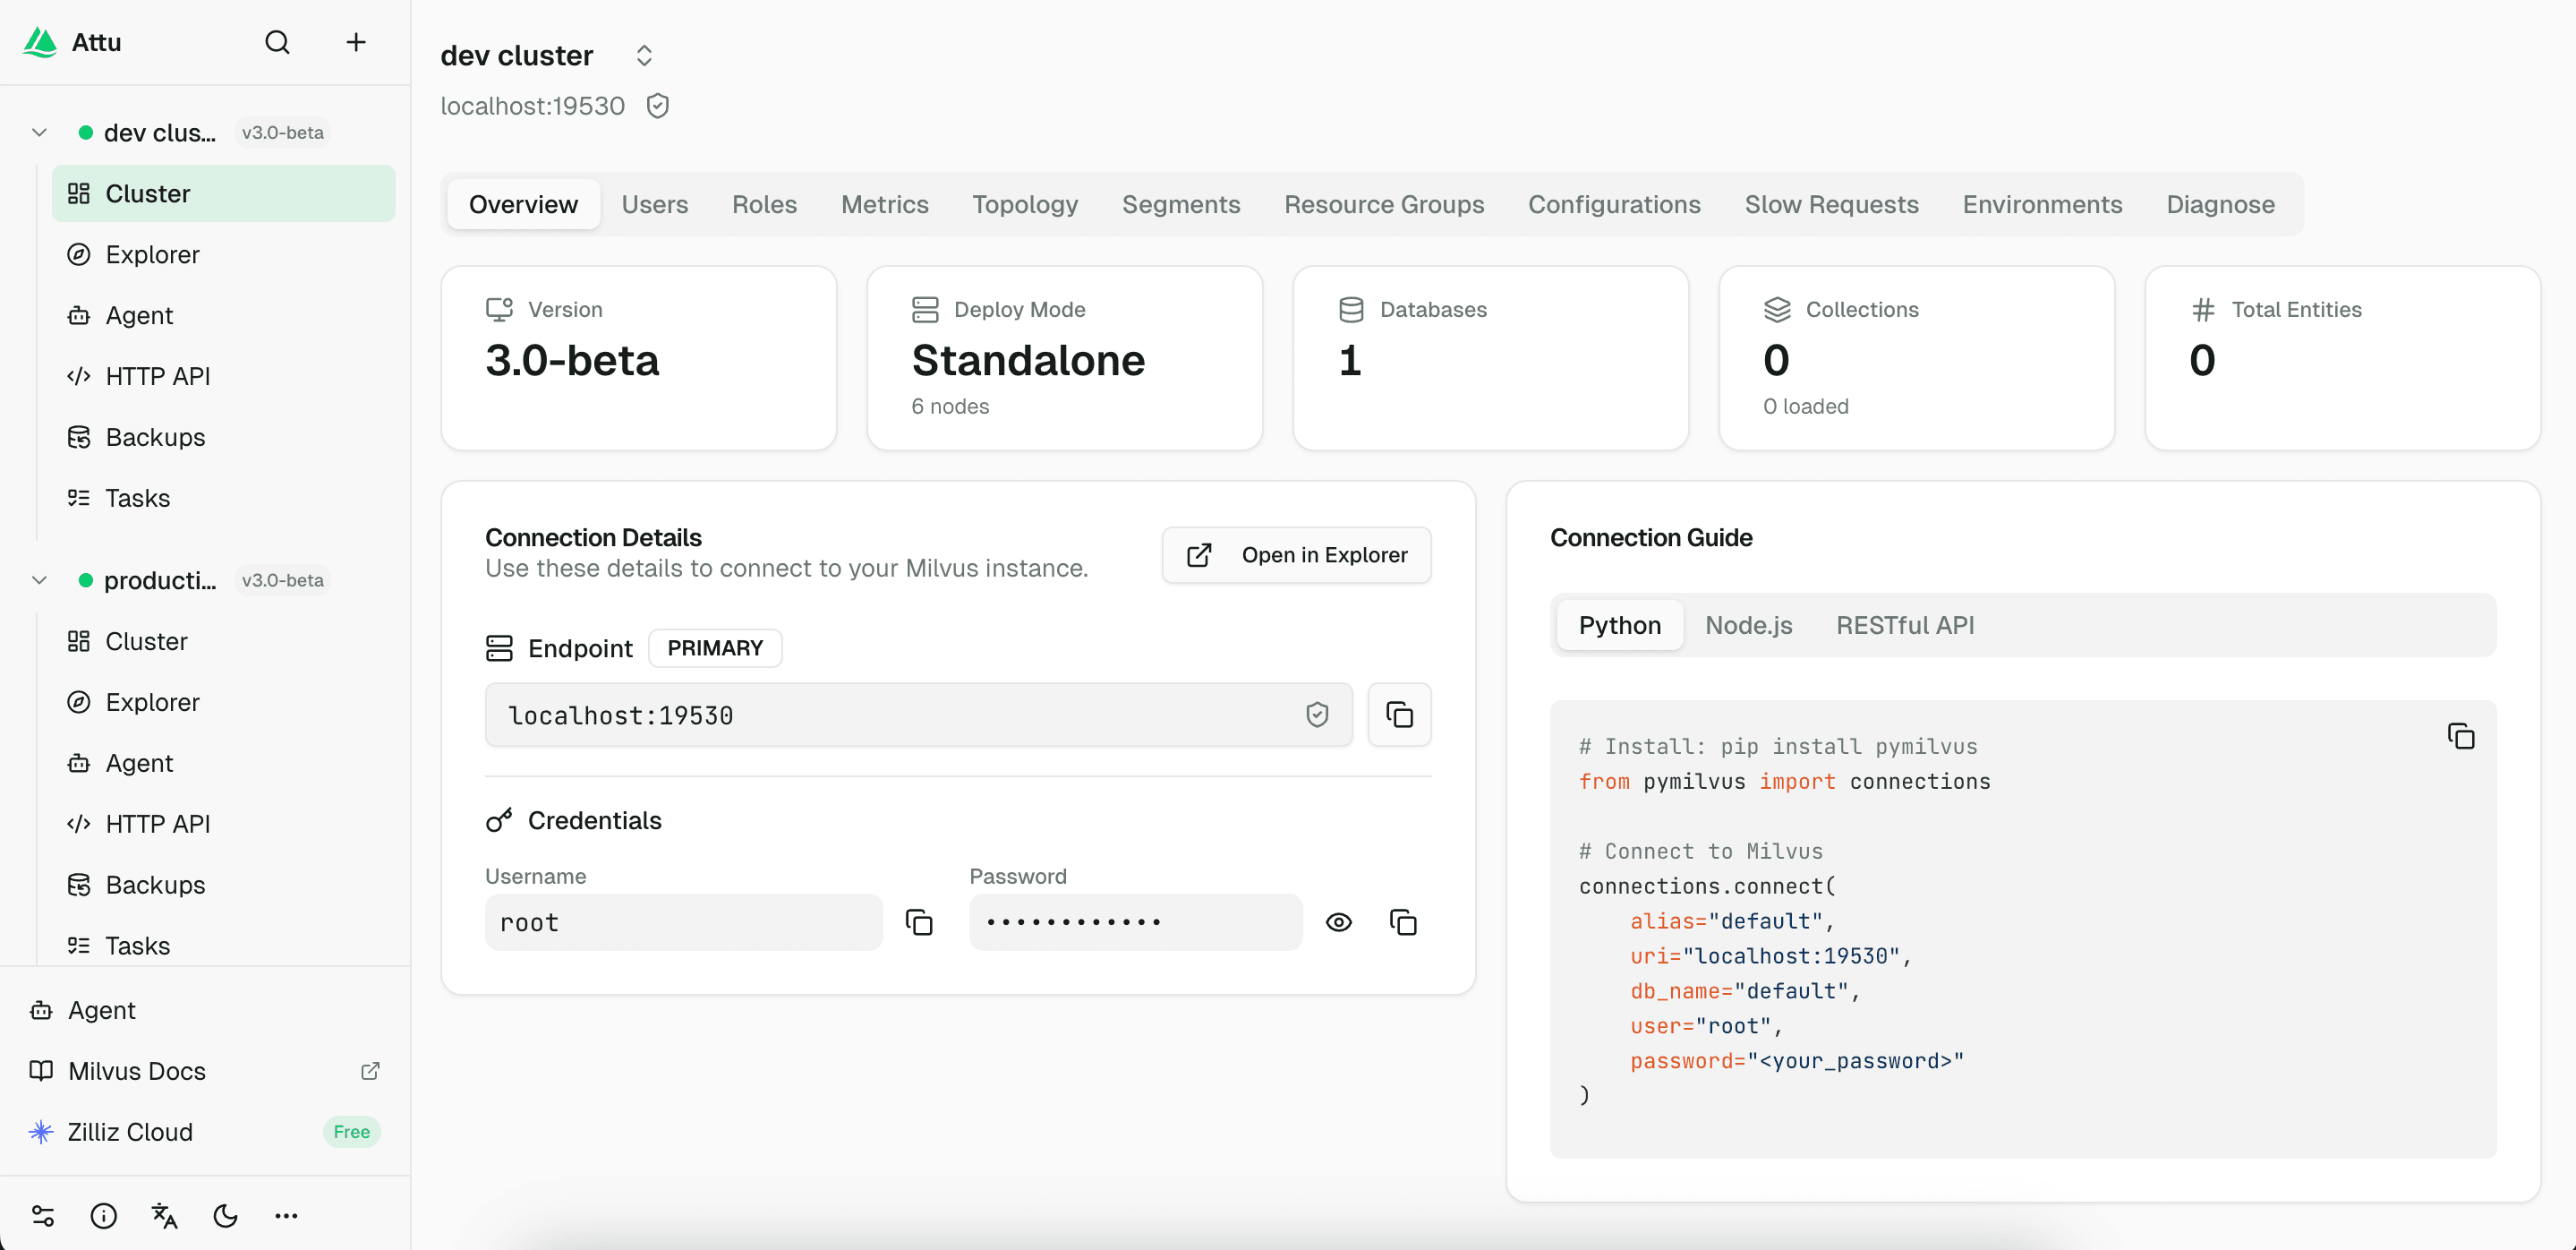
Image: Attu 3.0 sidebar showing multiple Milvus connections with health indicators
In Attu 2.x, switching from one Milvus cluster to another meant disconnecting, reconnecting, and waiting. If you had separate clusters for development, staging, production, or different business lines, you often ended up with one browser tab per cluster.
Attu 3.0 replaces that flow with a persistent left sidebar. Every Milvus connection is listed in one place, with a live health indicator beside it. A green dot means the cluster is reachable. A red dot means the cluster is down or unavailable.
Switching clusters takes one click. Attu keeps the context for each connection, so you do not need to reconnect every time you move between environments.
Connection Setup Is Less Fragile
New connections support TLS/SSL encryption, token authentication, and username/password authentication. You can test a connection before saving it, keep connection details locally, and bulk-clear dead connections when old environments are no longer needed.
Each cluster gets its own workspace. Overview, data browser, user management, metrics, and operations are all scoped to the currently selected cluster. That makes it much harder to confuse staging and production or run an operation in the wrong place.
For anyone managing more than one Milvus instance, this is one of the most important changes in Attu 3.0. It sounds basic, but it removes a large amount of tab switching and reconnect friction from daily Milvus work.
Local State Now Survives Restarts
Attu 2.x was stateless. If the container restarted, your saved connection information disappeared and you had to rebuild your workspace.
Attu 3.0 adds a local database that persists cluster configs, agent conversation history, custom skills, LLM configuration, and user preferences.
When running Attu with Docker, mount a volume to keep that state:
docker run -d --name attu -p 3000:3000 -v attu-data:/data zilliz/attu:v3.0.0-beta.6
With the volume mounted, restarting the container no longer means starting from zero.
This also matters for the new AI Agent. Conversation history, custom skills, and LLM configuration can persist locally, so Attu becomes a console you can keep using over time rather than a temporary UI that resets after each restart.
Use the Built-in AI Agent to Operate Milvus in Natural Language
Attu 3.0 includes a built-in AI Agent for Milvus management. This is not a documentation chatbot. The agent is connected to 50+ Milvus tools, so it can inspect cluster state and execute real operations through Attu.
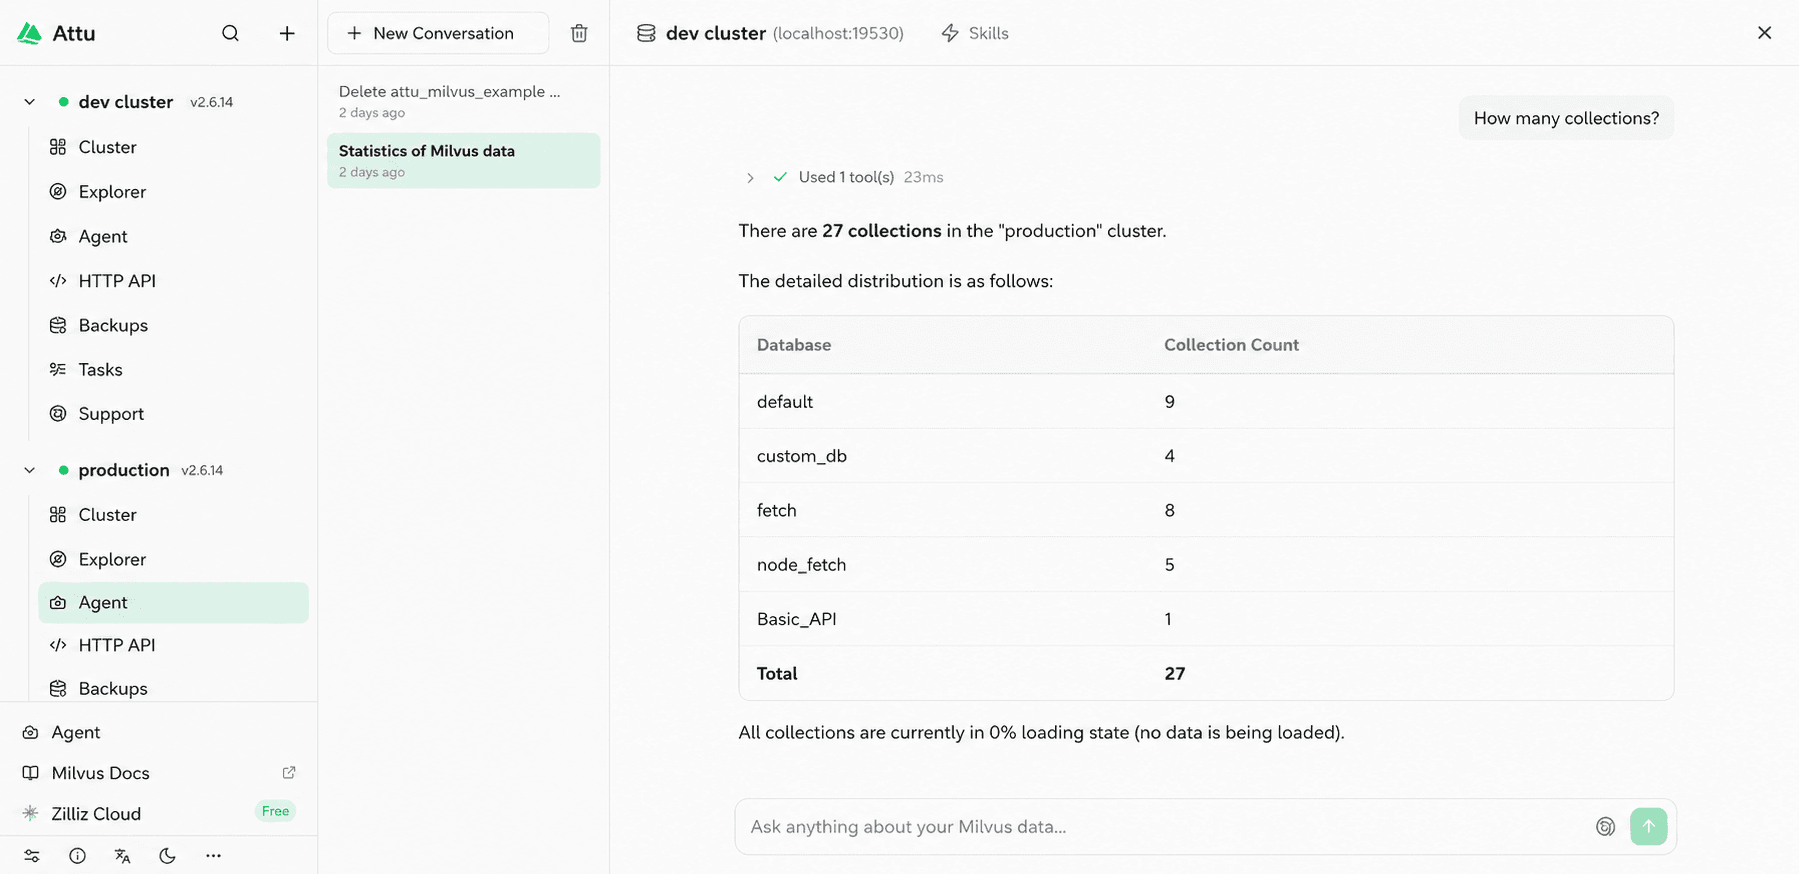
Image: The Attu 3.0 AI Agent can call Milvus tools from natural-language requests
50+ Built-in Tools Across Common Milvus Workflows
The Agent covers everyday operations, diagnostics, permissions, and cluster management. You can ask questions or issue instructions such as:
| Scenario | Example prompts |
|---|---|
| Everyday operations | “List all my collections.” “Create a collection with id, title, and embedding fields. Use dimension 768 for the embedding field.” “Insert some test data into my_collection.” “Search my_collection for the 10 records most similar to 'artificial intelligence’.” |
| Ops and diagnostics | “Is my cluster healthy?” “Why is search so slow?” “Which collections use the most memory?” “Any slow queries recently?” |
| Permissions | “Create a read-only user called analyst.” “Grant all privileges to the admin role.” “Check which privileges user zhangsan has.” |
| Cluster management | “Show the current Milvus version and config.” “List resource-group usage.” “Compact my_collection for me.” |
Destructive Actions Require Approval
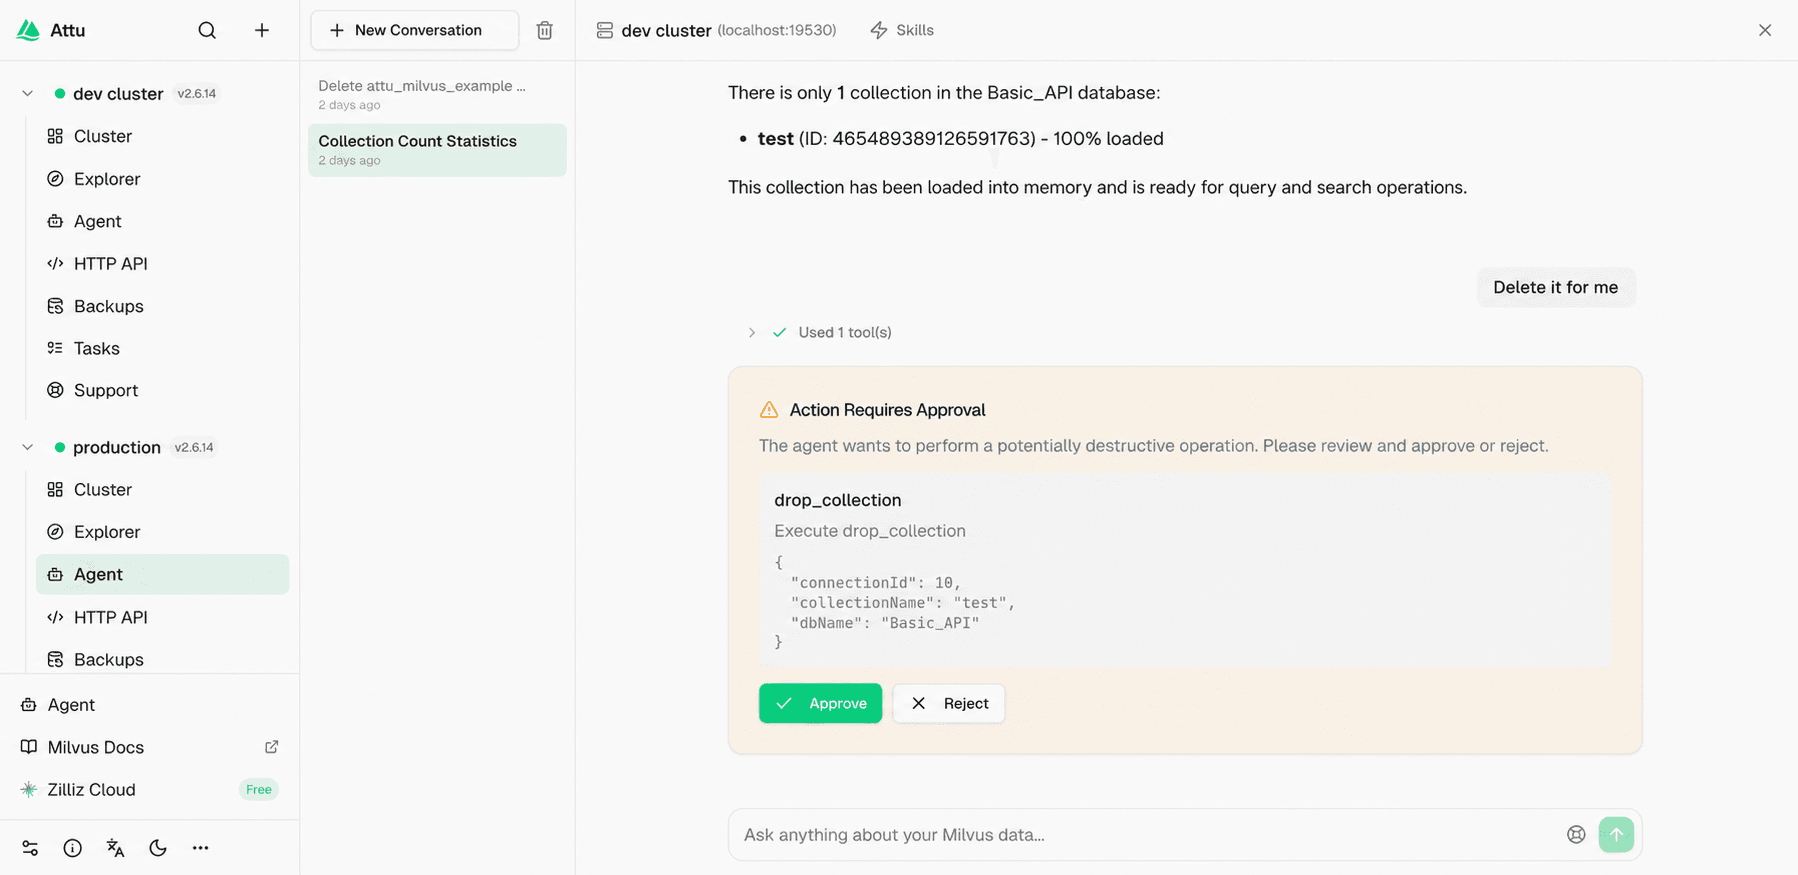
Image: Destructive or sensitive operations show a confirmation dialog before execution
The agent is designed to be transparent and controllable. Non-destructive operations, such as listing collections or reading metrics, return results directly.
Destructive or sensitive operations, such as dropping a collection, clearing data, or changing privileges, trigger a confirmation dialog. The dialog lists the exact parameters and waits for approval before the operation runs.
You can also see which tools the agent called, how many tokens it used, and whether any tool call failed. That matters for a database management agent. Users should be able to understand what the agent did, not just see the final answer.
Run Expert Diagnostic Skills From the Console
The AI Agent ships with four built-in diagnostic skills. These are guided workflows for common Milvus troubleshooting scenarios, not generic prompts.
| Diagnostic skill | What it checks |
|---|---|
| Cluster health diagnosis | Version, node status, per-component health, and key metrics. |
| Search performance diagnosis | Index sanity, segment fragmentation, replica balance, and related search-performance signals. |
| Data write diagnosis | Slow inserts, lost data checks, flush anomalies, and write-path symptoms. |
| Configuration audit | Risky or incorrect settings that may affect stability, performance, or expected behavior. |
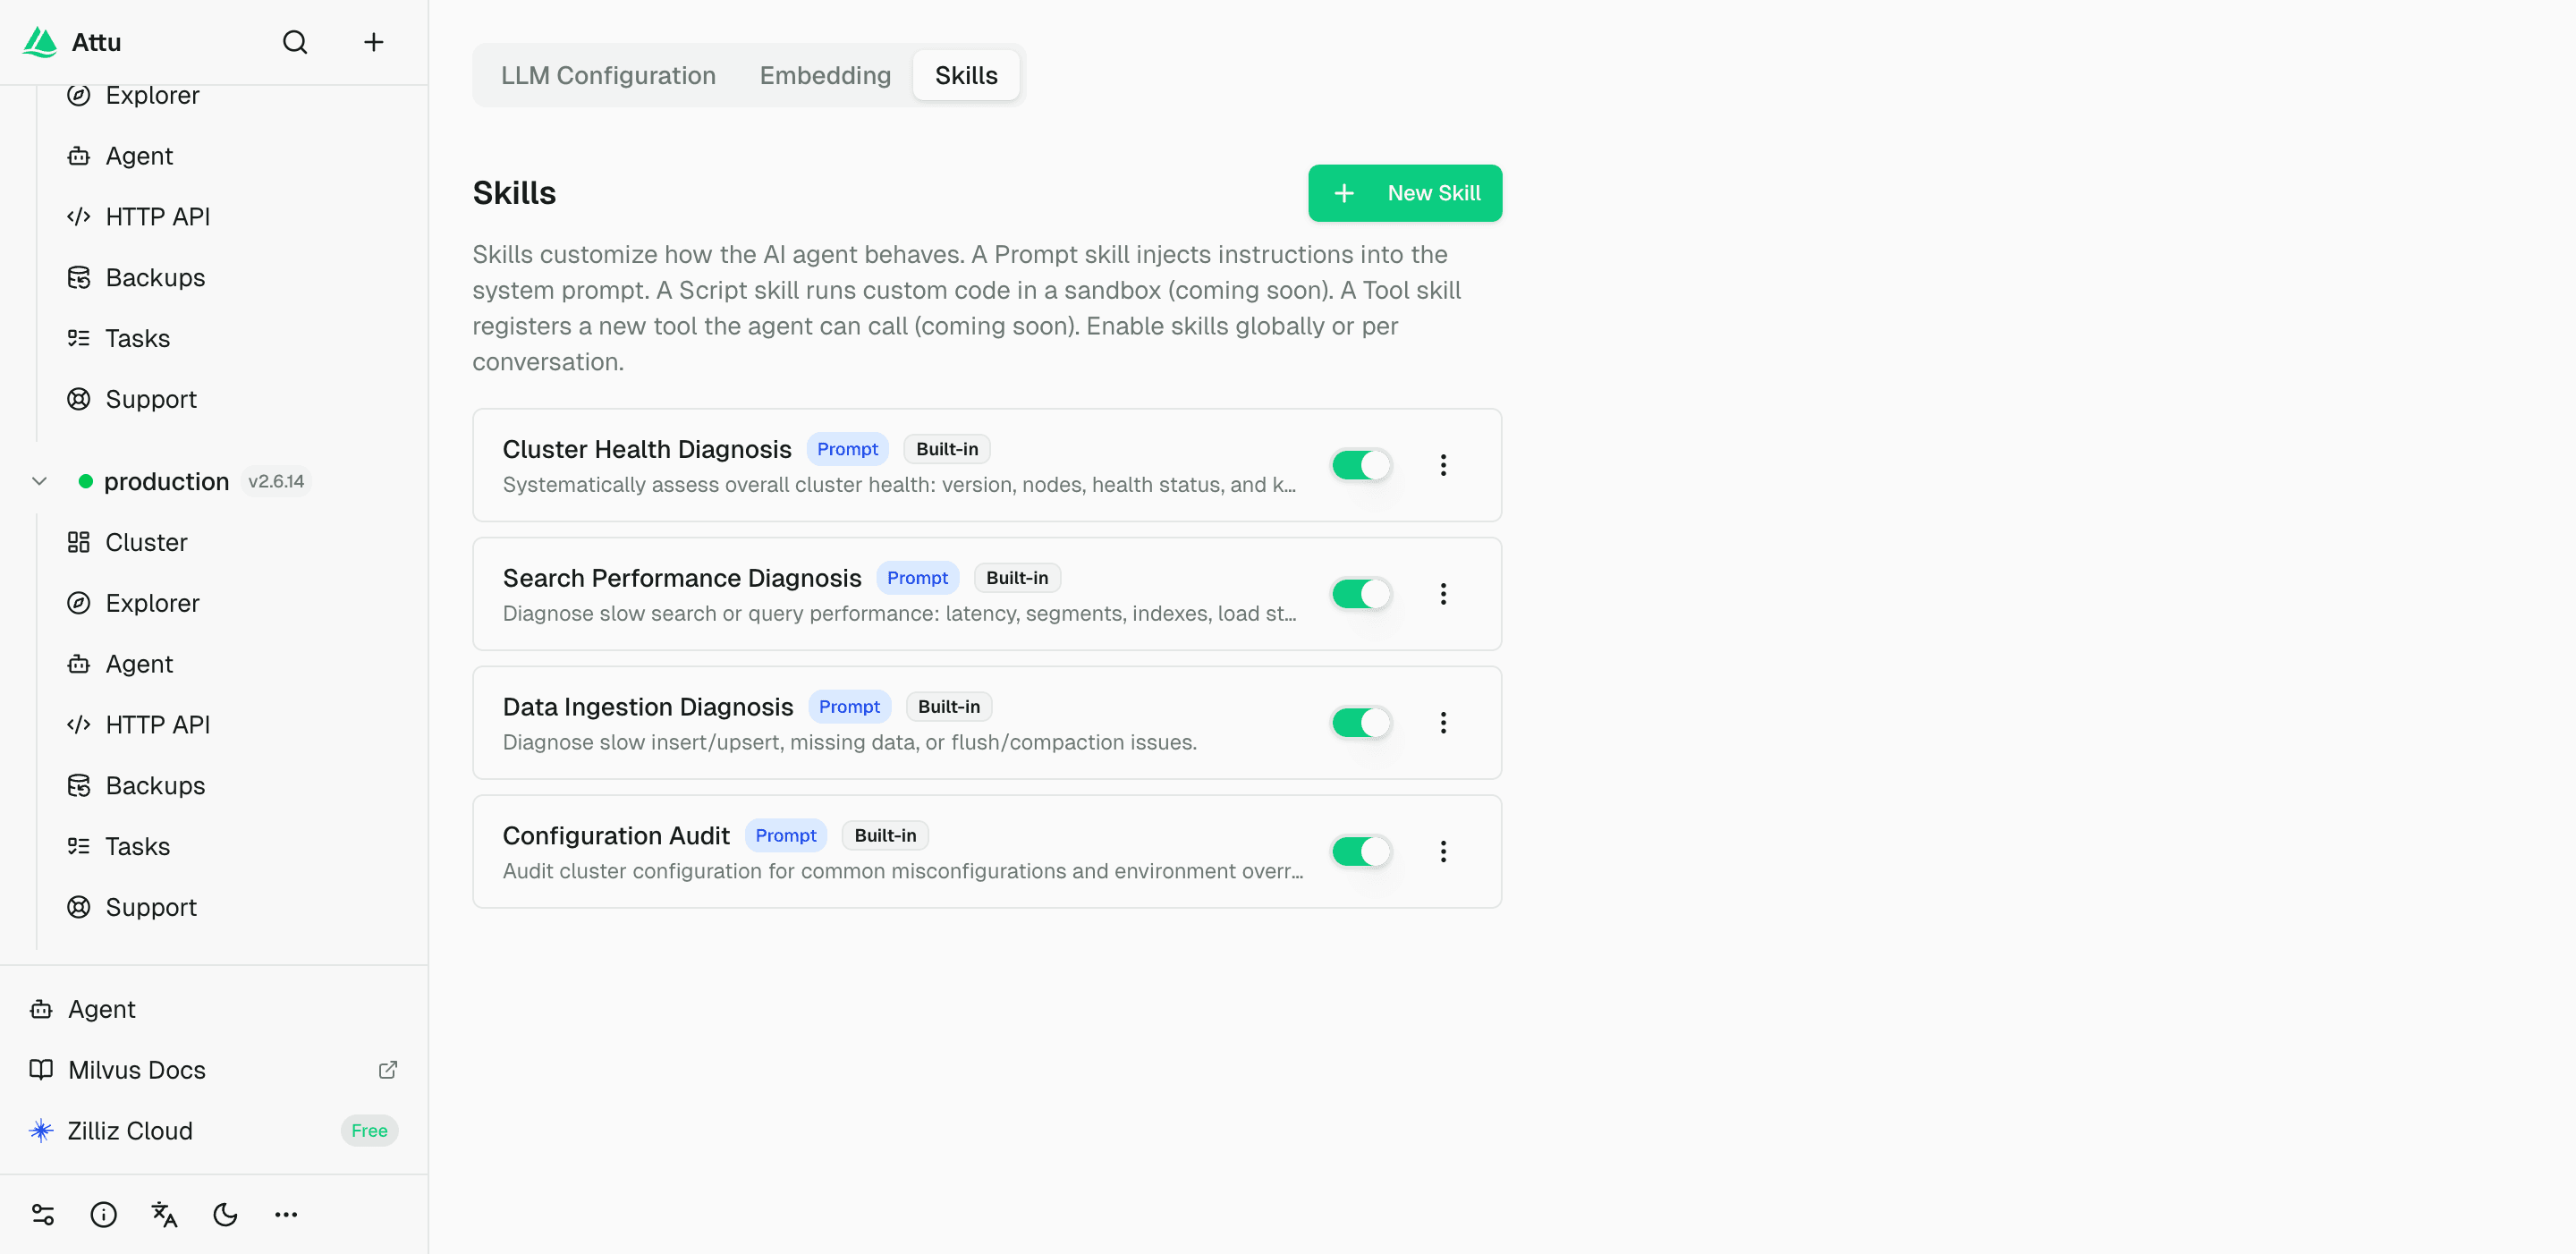
Image: Attu 3.0 includes built-in diagnostic skills and supports custom skills
You can also create custom skills in natural language. A skill can encode a pre-launch checklist, a data-quality check for a specific collection, or a diagnostic flow your team runs for a known workload.
A custom skill is essentially domain knowledge plus a procedure. Once saved, the agent can reuse it instead of relying on a one-off prompt every time.
Bring Your Own LLM Provider
Attu does not bundle or proxy an LLM service. You configure your own provider and keep control of the model path.
The supported provider options include OpenAI, Anthropic, DeepSeek, Google Gemini, OpenRouter, and custom OpenAI-compatible endpoints.
| Provider | Example models |
|---|---|
| OpenAI | GPT-5.5 |
| Anthropic | Claude Opus 4.8 |
| DeepSeek | DeepSeek-V4 |
| Google Gemini | Gemini 3.5 |
| OpenRouter | Any routed model |
| Custom endpoint | Any OpenAI-compatible API |
Your API key is encrypted locally and is not uploaded to an Attu-managed service. That design is important for teams that want AI assistance but still need to control credentials, data flow, and provider choice.
In practice, BYOL makes the agent usable across different environments. One team might use OpenAI. Another might use an Anthropic model. A third might route through an OpenAI-compatible endpoint. Attu does not force a single model provider.
Browse Milvus Data With a Database → Collection → Partition Tree
Attu 3.0 also redesigns the data browser. Attu 2.x mainly presented a flat collection list. That becomes hard to use once a cluster has multiple databases, dozens of collections, and partitioned data.
The new browser uses a hierarchy that matches how Milvus organizes data: database → collection → partition.
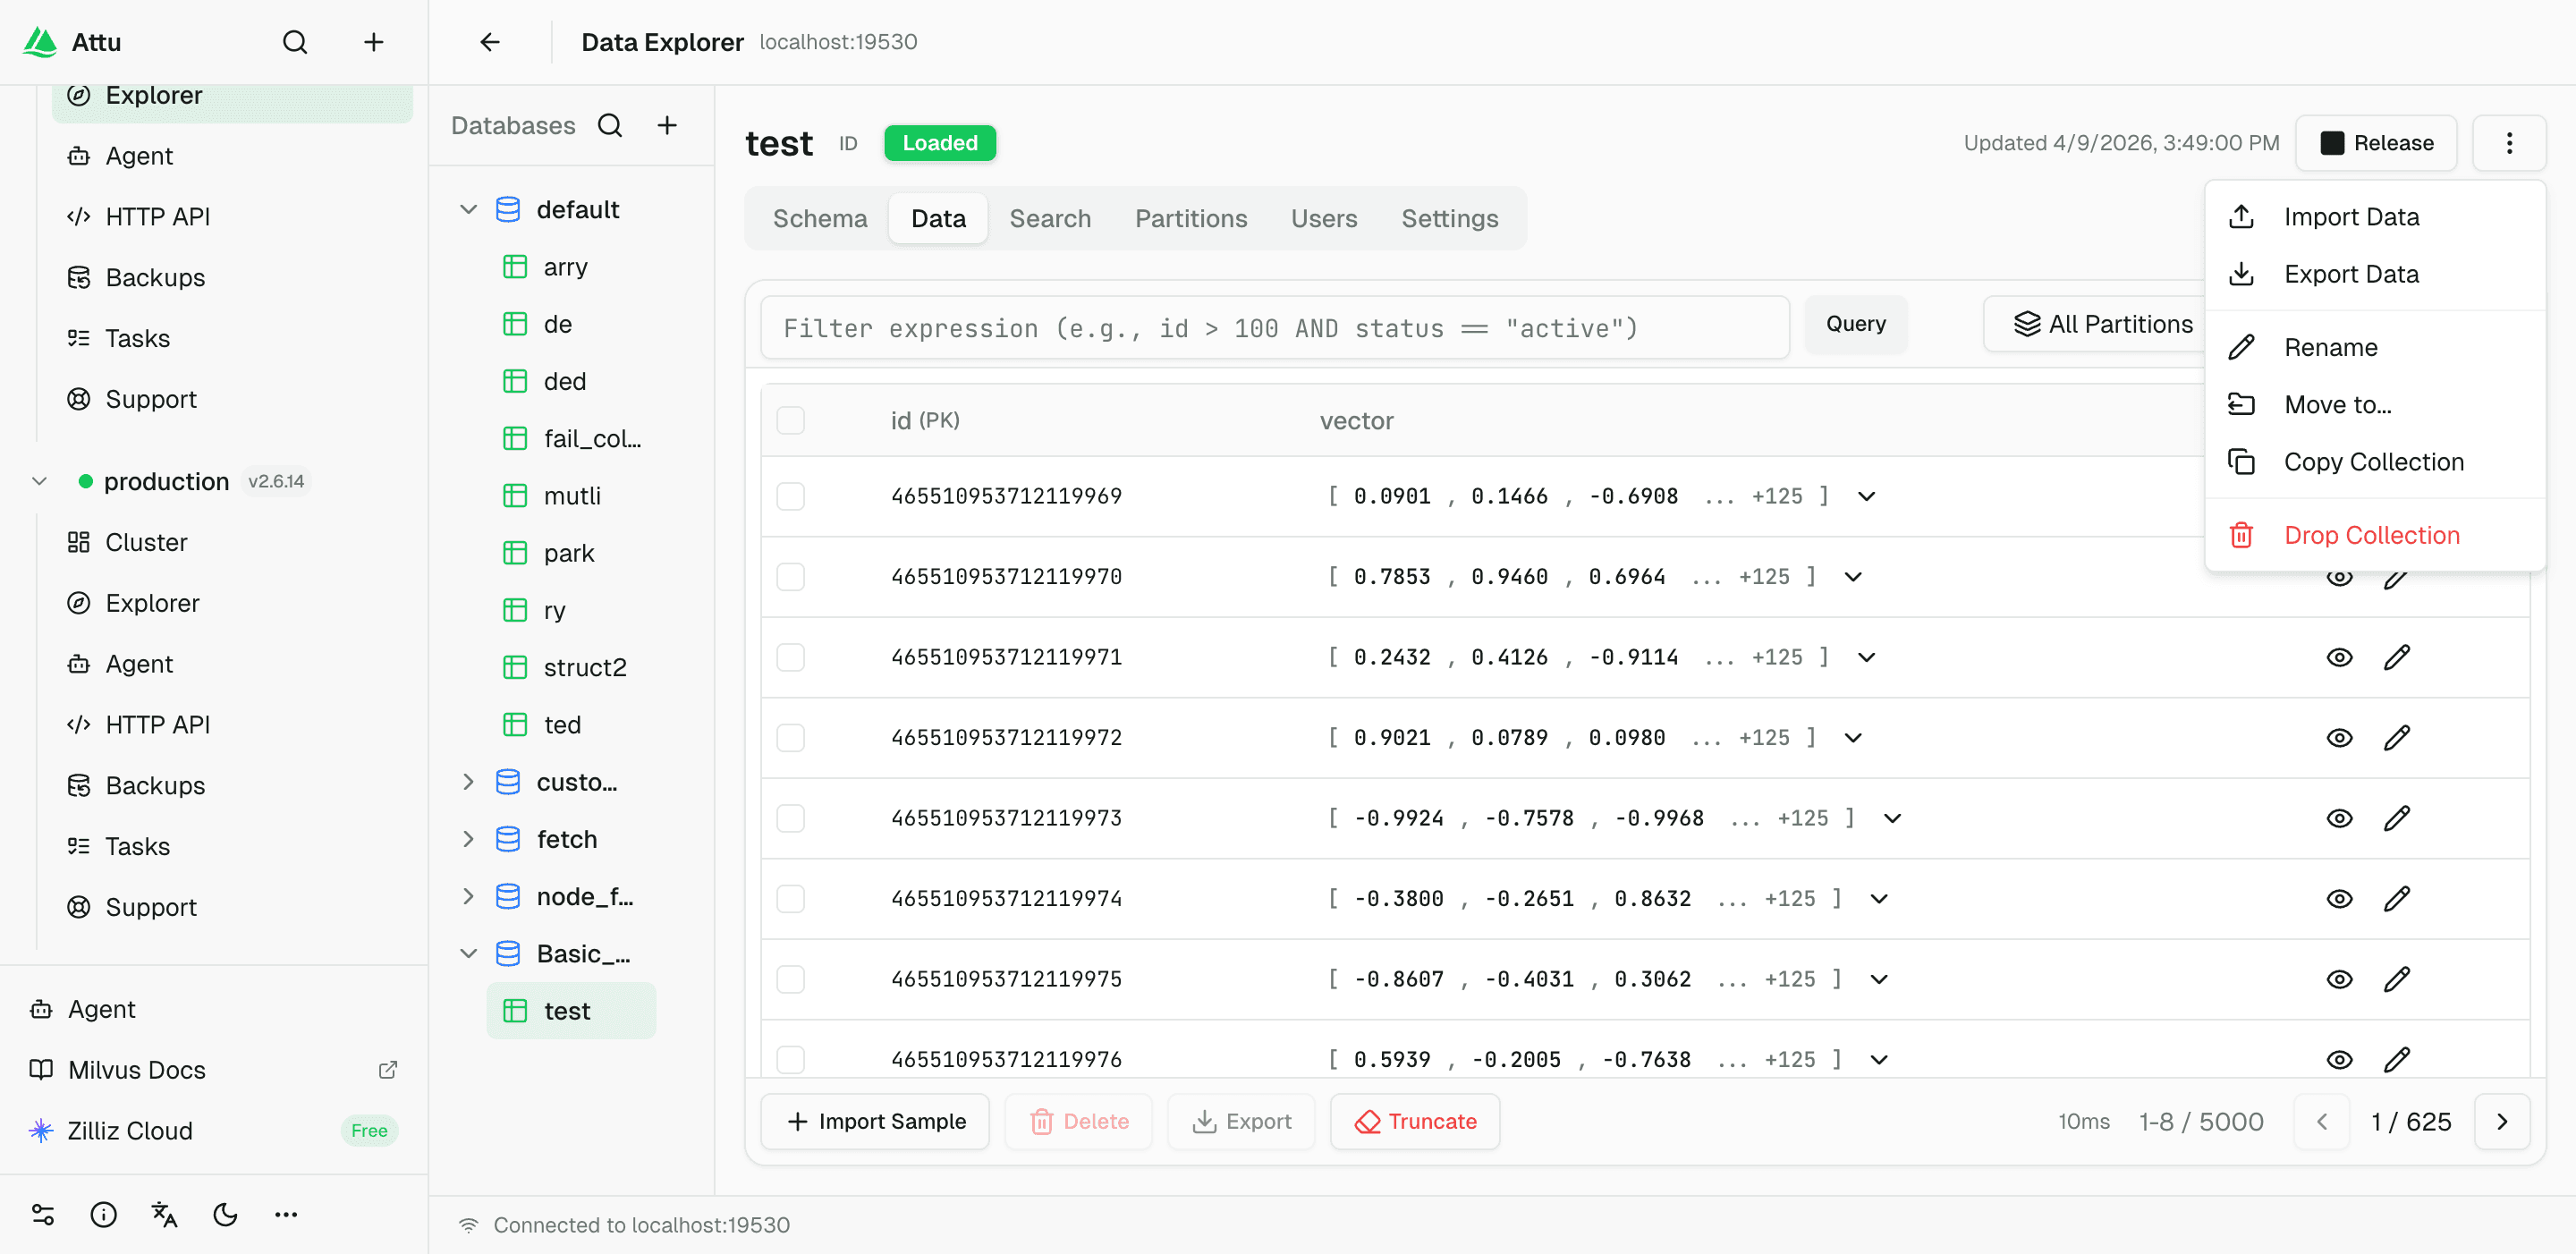
Image: The redesigned data browser uses hierarchical navigation for databases, collections, and partitions
Data Operations Are Closer to Where You Browse
The data browser keeps the operations users already expect and adds more actions directly in the UI:
- Drag and drop a collection into another database.
- Run vector search by typing text directly, when an embedding model is configured.
- Inspect similarity scores and narrow results with facets.
- Import and export data in CSV, JSON, and Parquet.
- View and edit a collection schema visually, including dynamic-field support.
- Create, delete, and inspect partitions and partition stats.
- Manage the full collection lifecycle: create, load, release, copy, rename, move across databases, and drop.
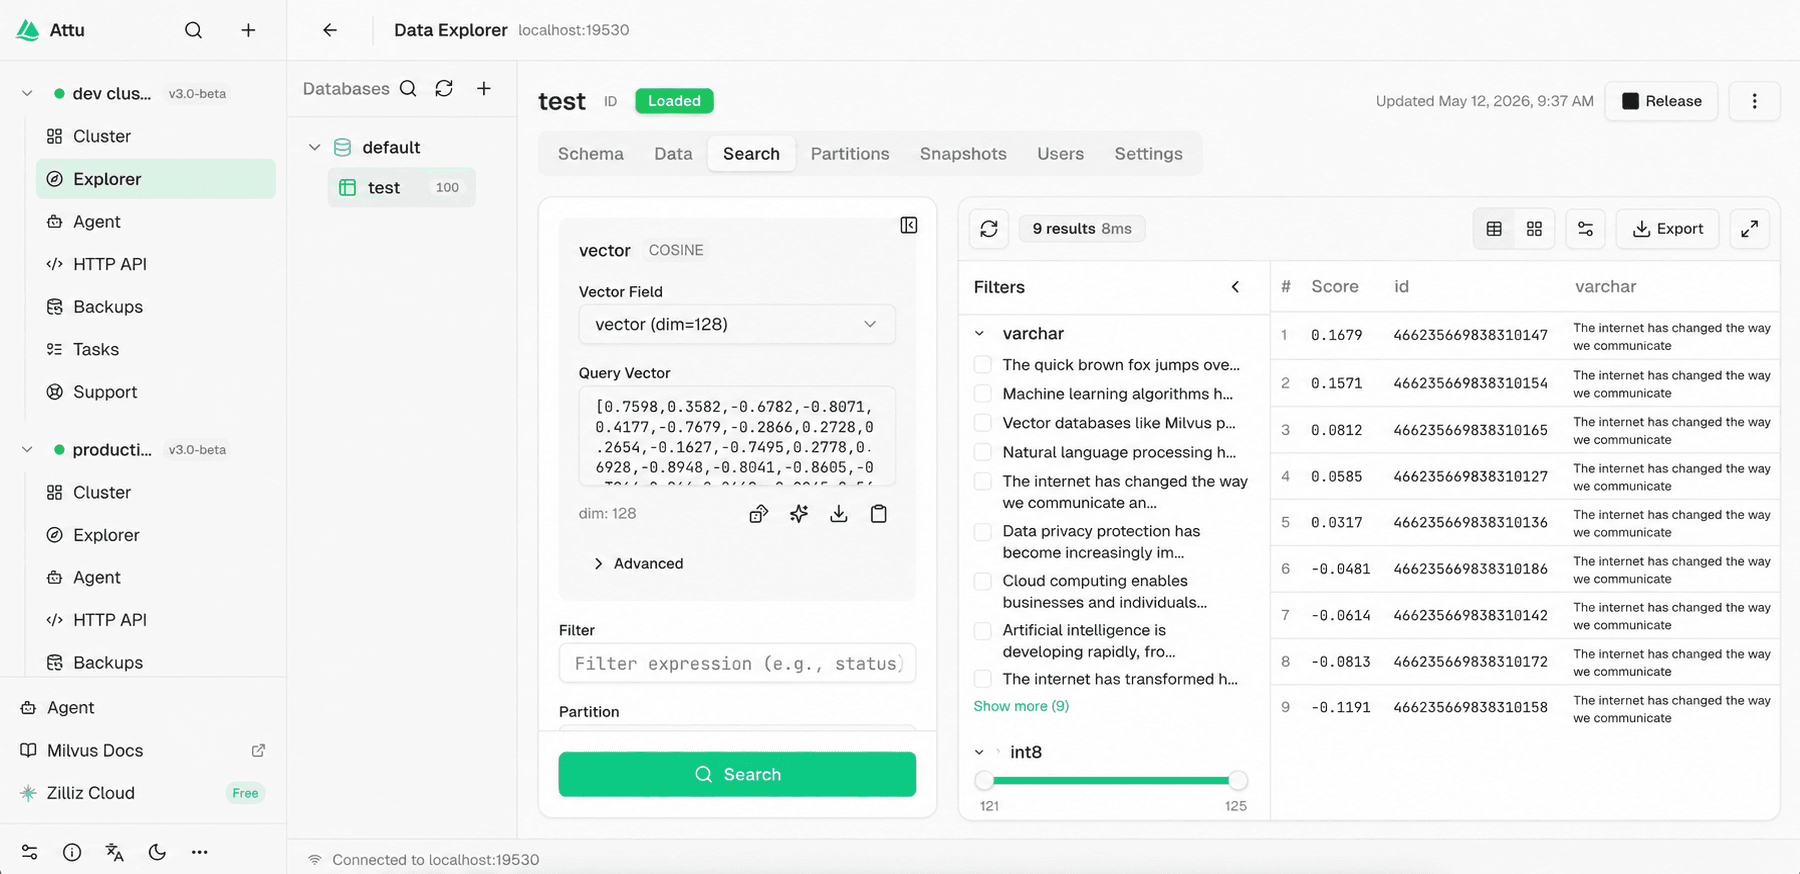
Image: Attu 3.0 data browser with vector search and result inspection
Most of these actions are available through right-click menus or operation panels. For common collection work, you no longer need to jump between UI browsing and command-line operations.
Attu 3.0 is also the product line where UI support for new Milvus 3.0 capabilities, such as snapshots and nullable vectors, will continue to appear as those features mature.
Check Operations, Metrics, Slow Queries, Topology, and Backups in One Place
Attu 3.0 puts more operational information into the console. The Ops and Monitoring area includes cluster overview, live metrics, slow-query analysis, topology, and backup and restore.
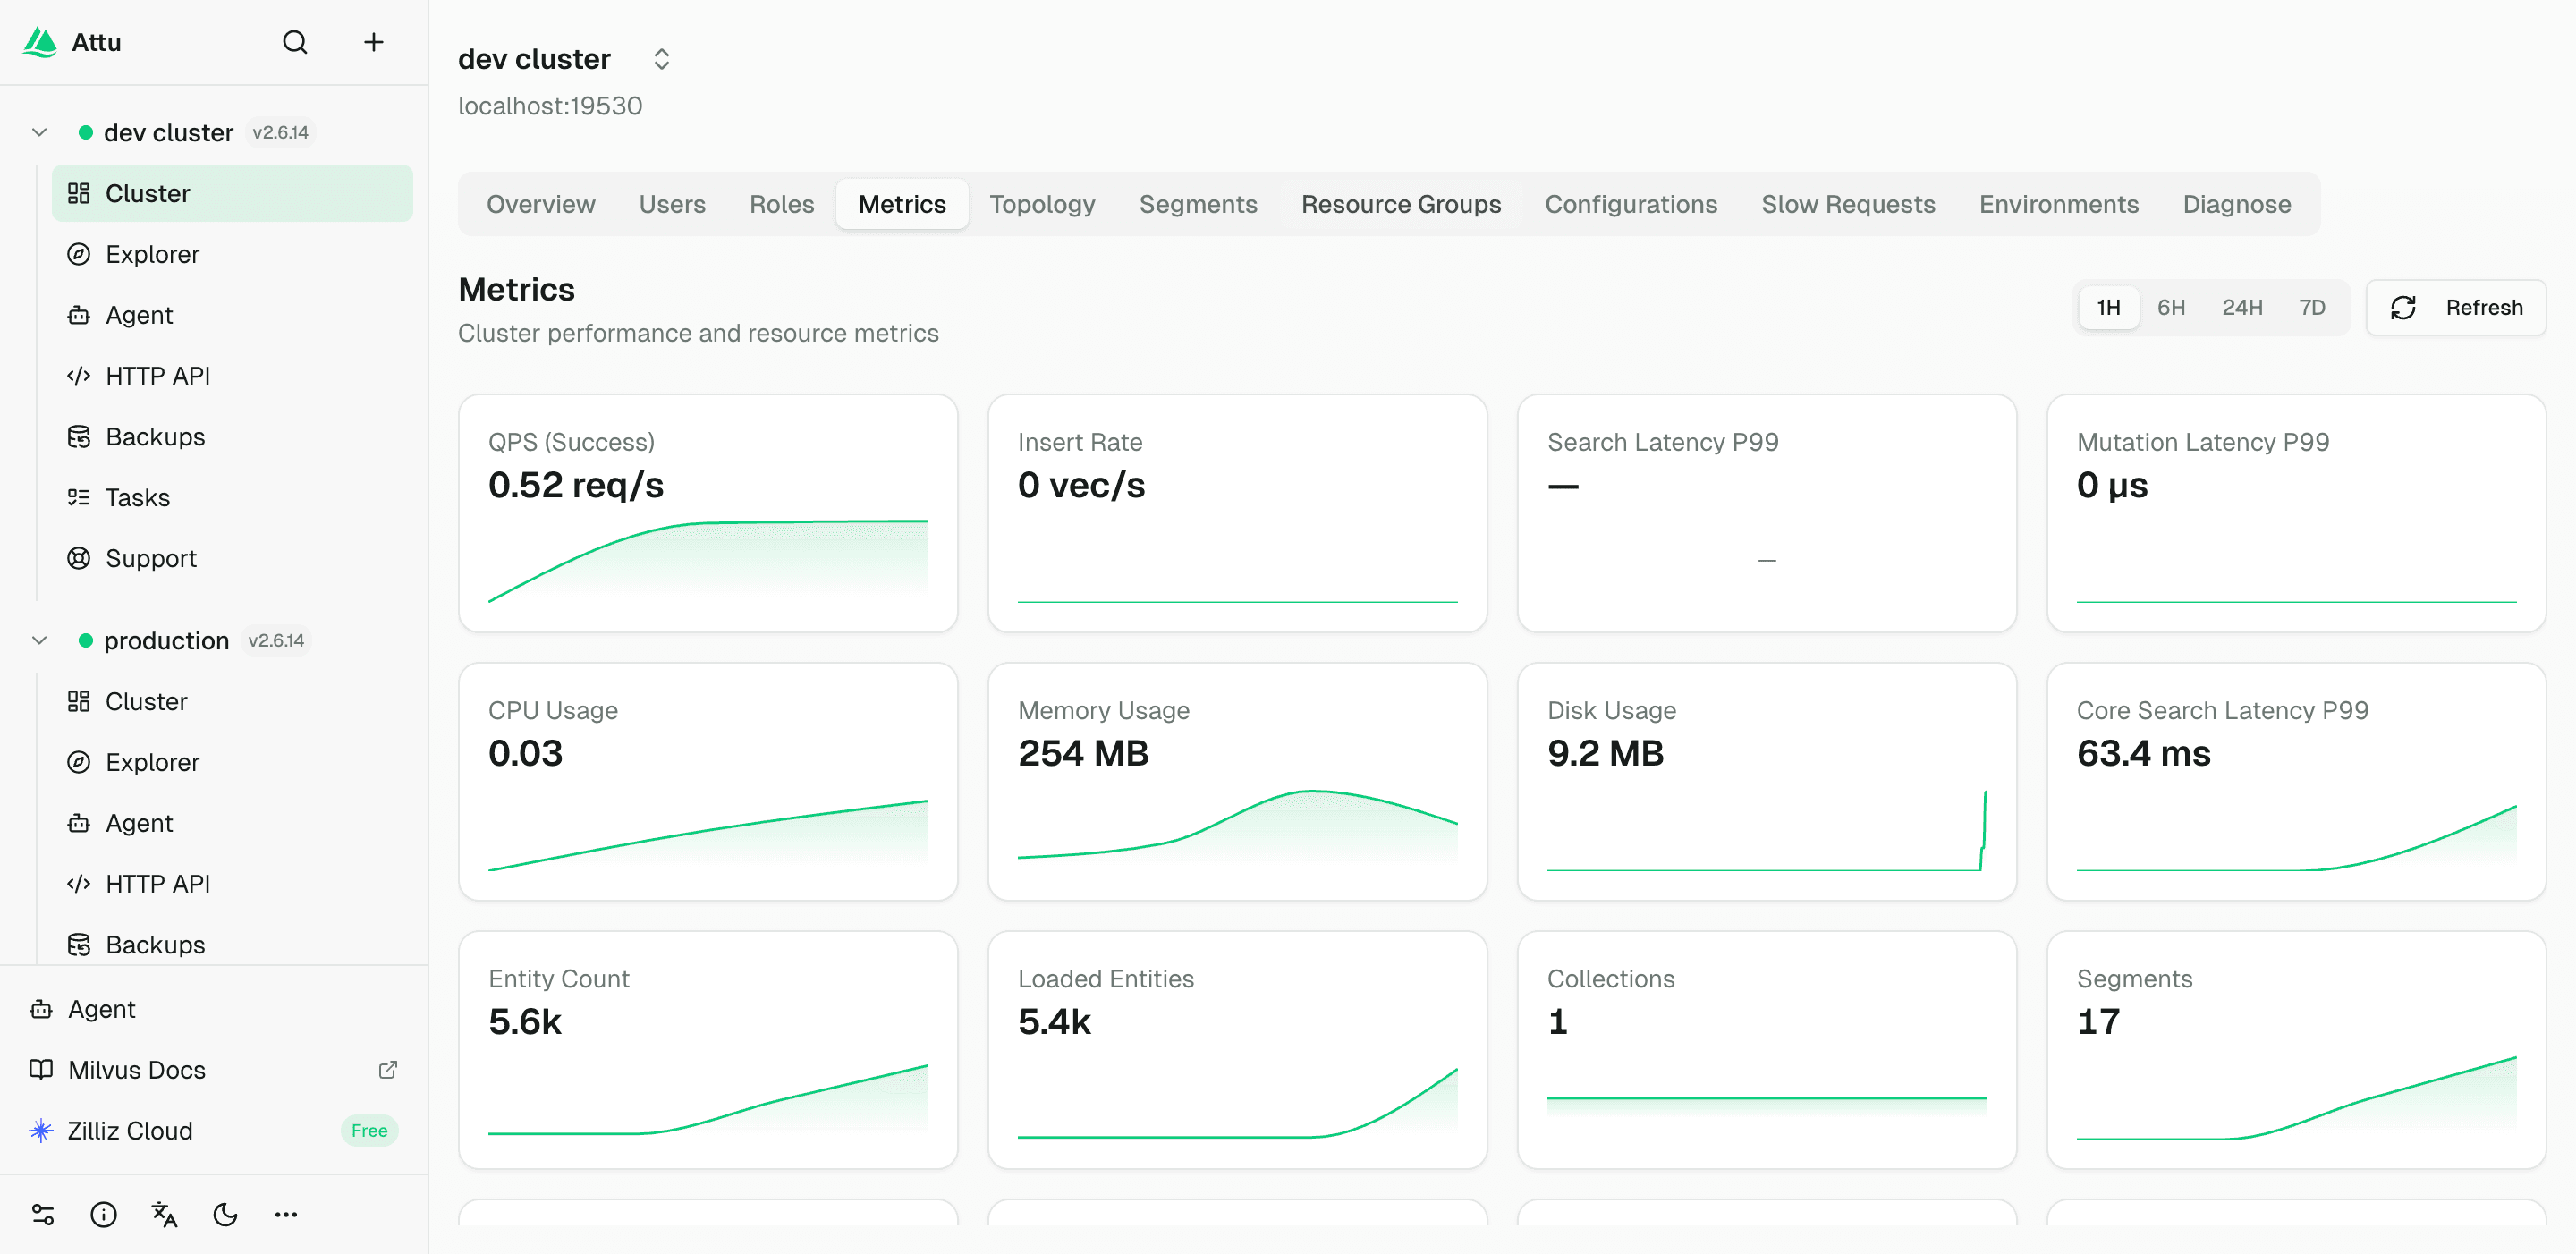
Image: Attu 3.0 Ops and Monitoring page
The goal is not to replace every observability system a production team already uses. Teams can still use Prometheus, Grafana, logs, alerts, and their existing monitoring stack. The goal is to make common Milvus questions answerable from inside Attu.
| Area | What you can do |
|---|---|
| Visual cluster overview | View Milvus version, deployment mode, node count, database count, collection count, load status, and quota entities at a glance. |
| Real-time metrics | Inspect QPS, insert/delete rates, query latency, cache hit rate, and related Prometheus-backed metrics. |
| Slow-query analysis | Inspect slow queries by type, duration, collection, timestamp, source, and related troubleshooting context. |
| Topology view | Understand the node topology and the connections between components such as RootCoord, DataCoord, IndexCoord, QueryCoord, and Proxy. |
| Backup and restore | Create full or incremental backups against S3, MinIO, GCS, or Azure, and download backup metadata as a ZIP or upload one to restore. |
Backup and restore are especially important because they move a workflow that previously depended on CLI usage into the GUI. That is useful for local testing, staging validation, and teams that want a more visible recovery path.
Debug Milvus REST APIs With the Built-in API Playground
Attu 3.0 adds a REST API Playground for Milvus API development and debugging.
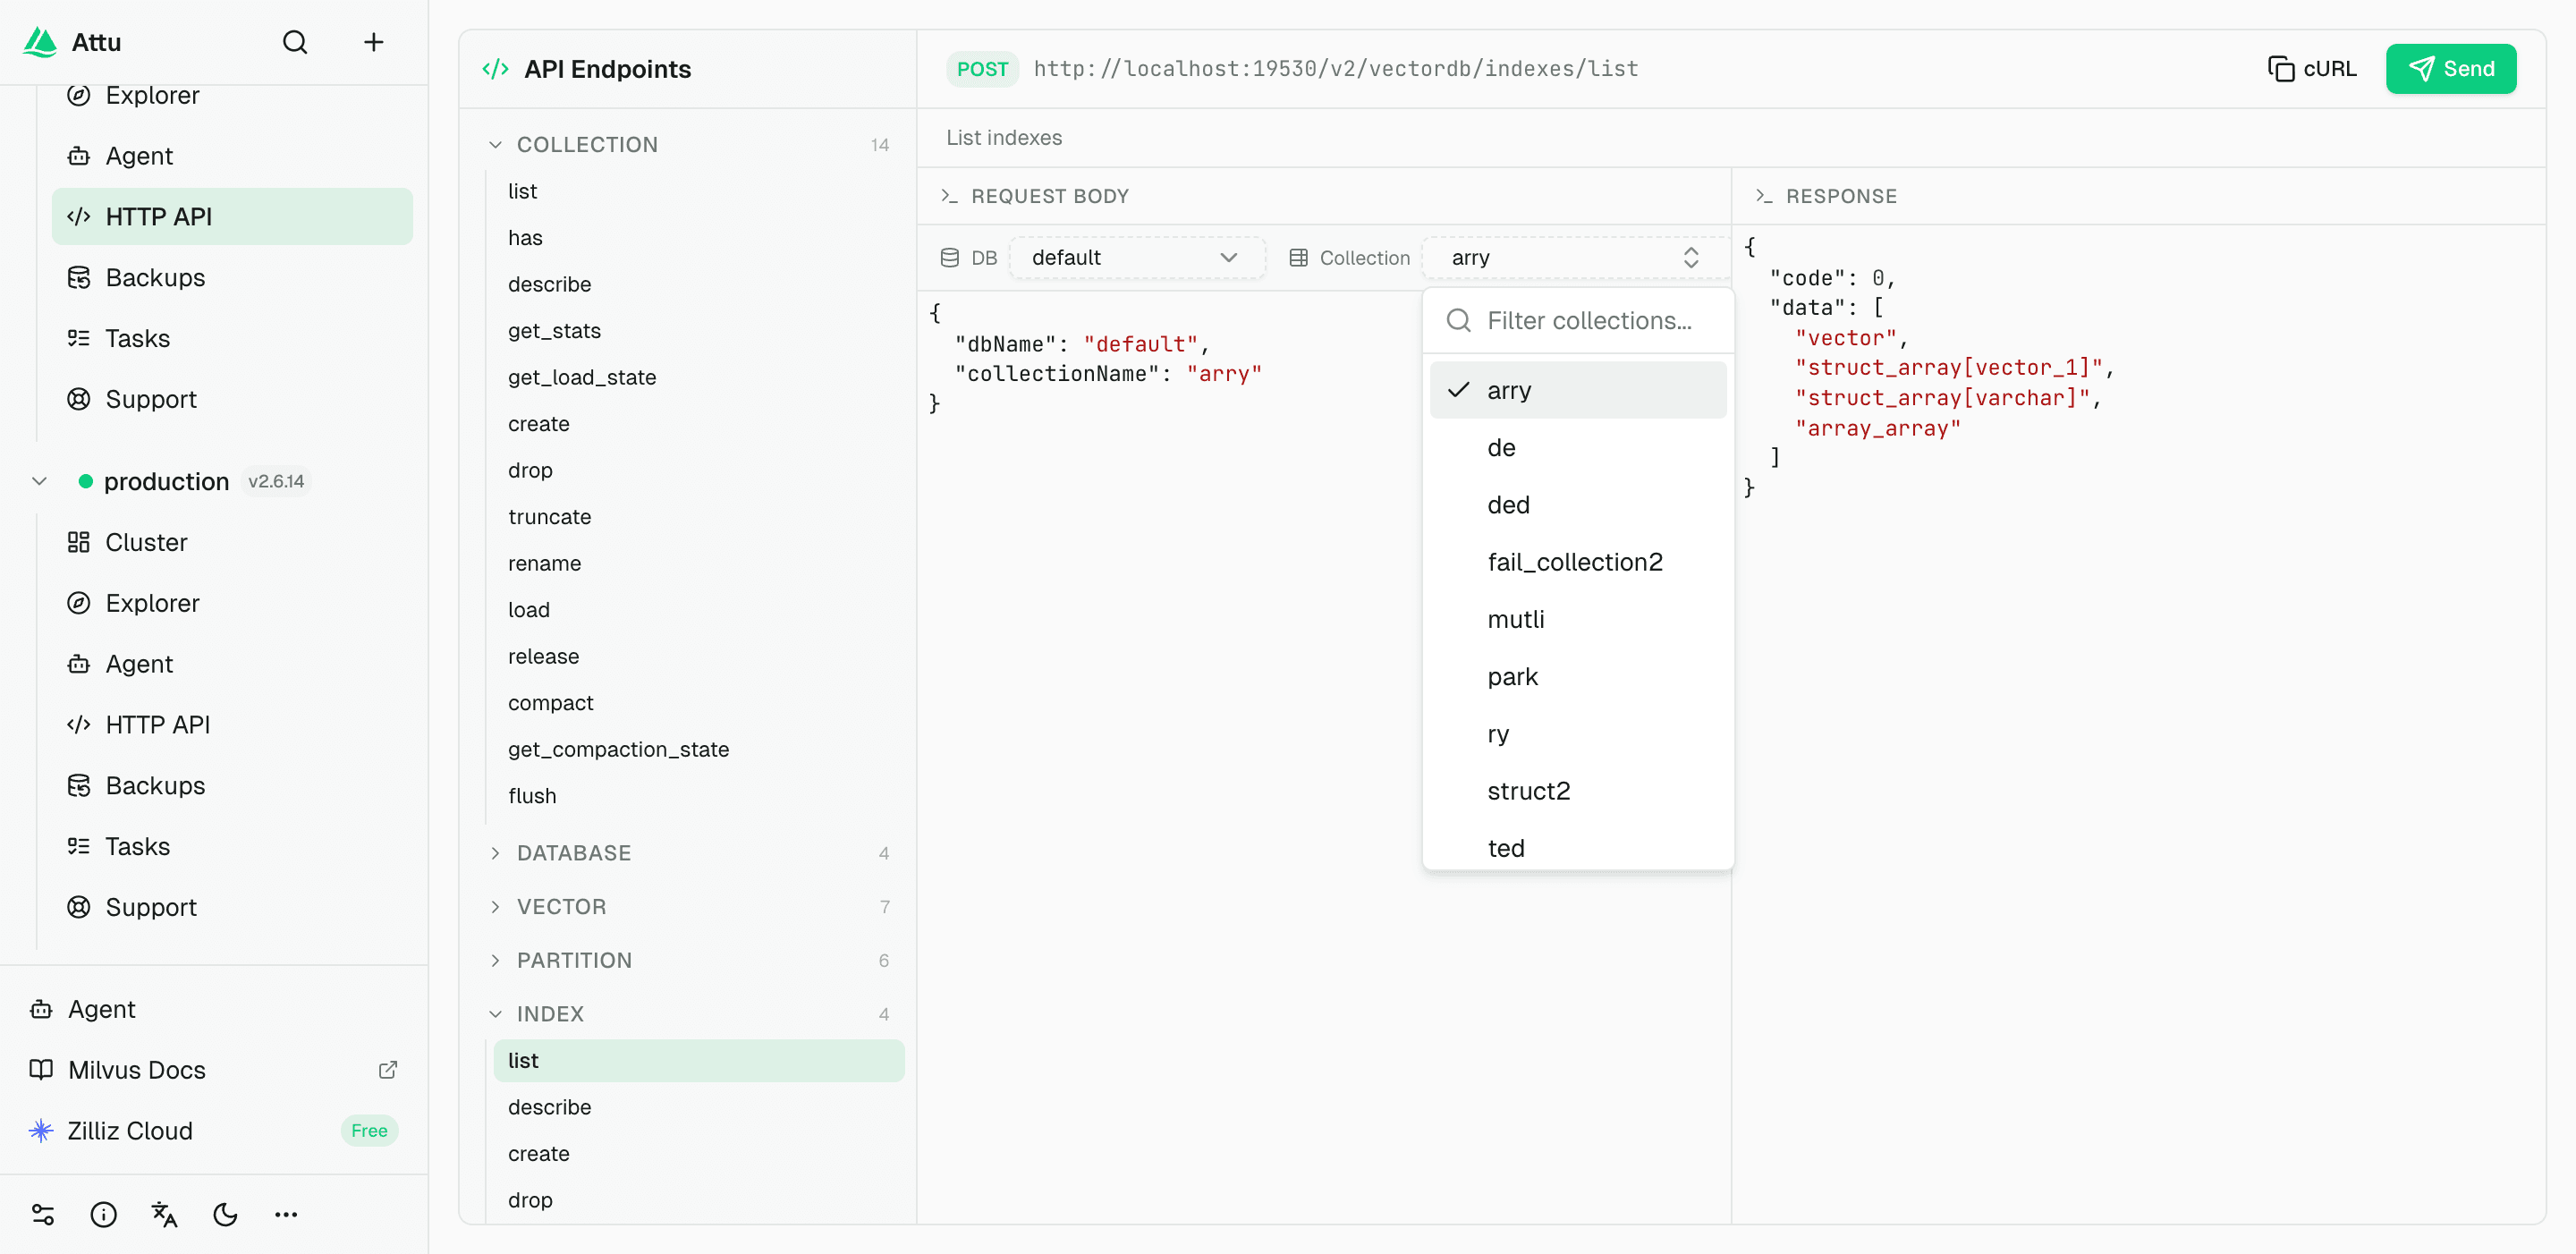
Image: Attu 3.0 API Playground
The Playground catalogs Milvus REST endpoints by category. Select a database and collection, and Attu fills in the run context automatically. From there, you can send a request in one click and inspect the response in real time.
This is useful when you want to test an API call without setting up curl commands or a Postman collection. It is also useful for learning how a Milvus feature maps to the REST API, because you can move between the UI context and the request body directly.
For application developers, the API Playground is a debugging surface. For new Milvus users, it is a learning surface. For platform teams, it is a quick way to validate operations before turning them into scripts or application code.
Manage RBAC Beside the Database or Collection
Attu 3.0 changes how permission workflows feel in the UI. Instead of treating RBAC as a separate admin task, it brings access control closer to the database and collection tabs where users are already working.
The underlying model is still Milvus RBAC: users, roles, privileges, grants, and revokes. Attu 3.0 simplifies the operating path around that model.
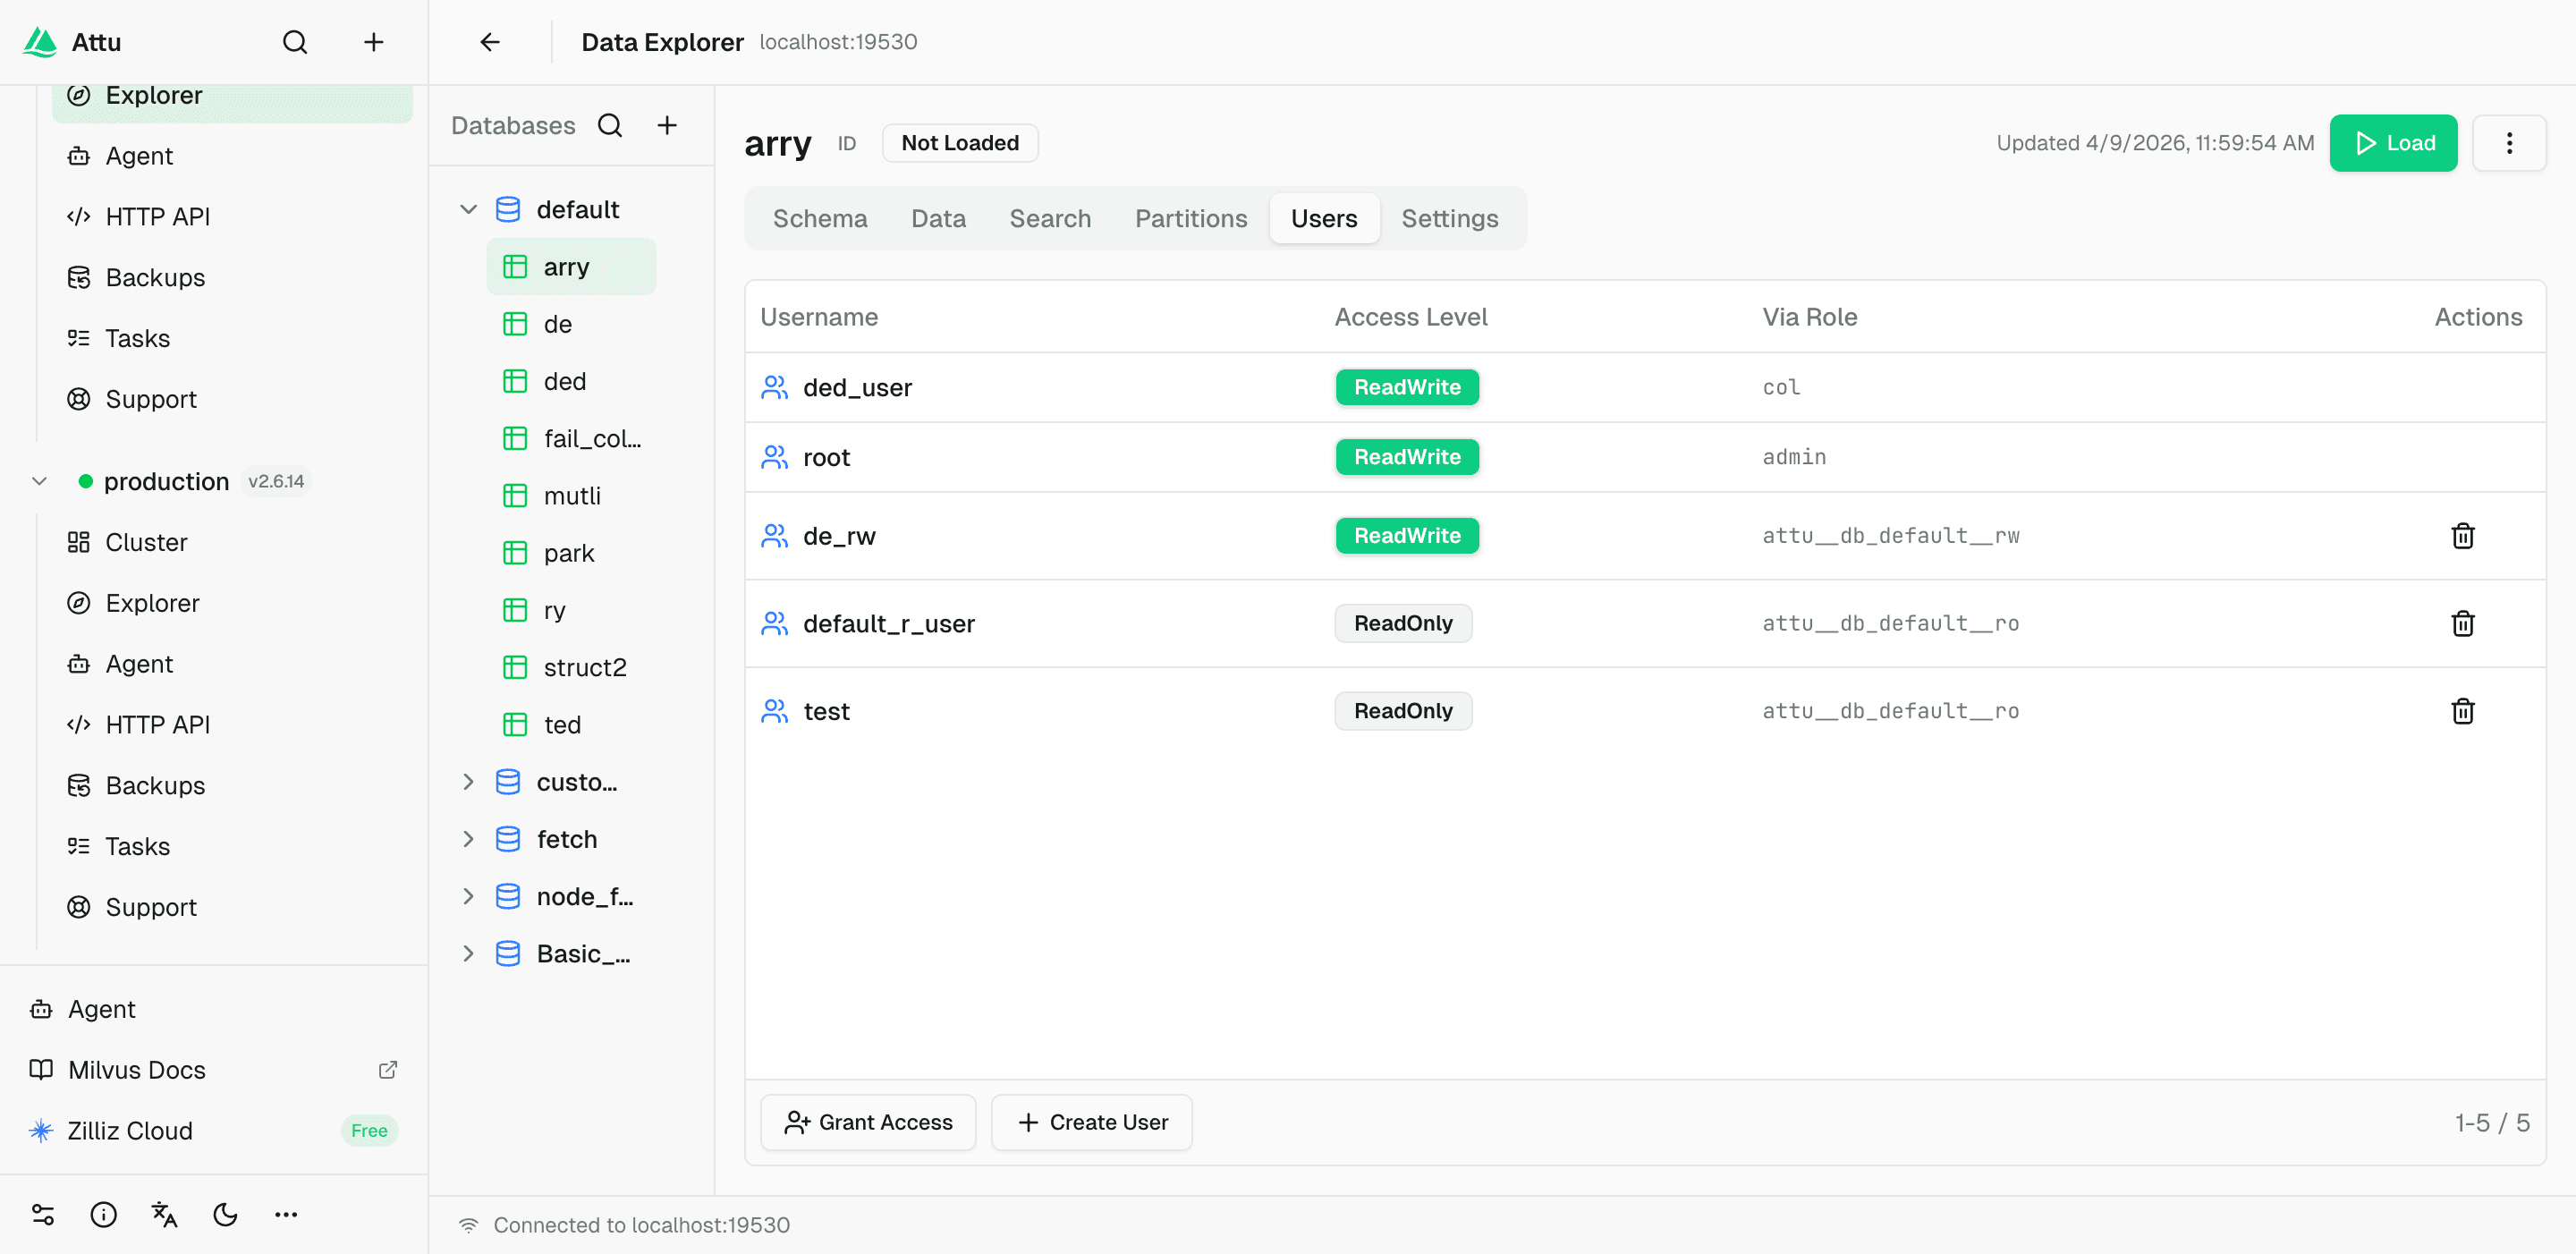
Image: In-context user and permission management in Attu 3.0
One-Click User Creation for Common Scopes
In Attu 2.x, opening read-only access to a collection usually involved several steps: create the user, create a role, configure privileges, assign the role to the user, and make sure the scope was correct.
In Attu 3.0, you can open a collection, go to the Users tab, click Create User, choose ReadOnly or ReadWrite, and let Attu complete the workflow. It creates the user, generates a secure password, creates the matching scoped role, and applies the grant.
The same pattern works at the database level. You can also authorize an existing user to the current collection or revoke access in one click.
This keeps permission management close to the resource being protected. You do not have to jump through several admin pages or remember a role naming convention just to give a teammate scoped access.
What This Beta Means for Attu Users
Attu 3.0 Beta is the biggest update to the Milvus management console since Attu first shipped. It is not just a visual refresh. It changes the scope of what Attu can handle.
The main upgrade is that Attu now fits the way many Milvus users actually work: multiple clusters, persistent local settings, more data movement, more access control, more troubleshooting, and more need to understand cluster behavior without switching between tools.
The highlights are:
- Multi-cluster management with health indicators and one-click switching.
- Persistent local state for cluster configs, preferences, LLM config, agent history, and custom skills.
- A built-in AI Agent with 50+ Milvus tools and confirmation gates for destructive actions.
- Four built-in expert diagnostic skills for cluster health, search performance, data writes, and configuration review.
- A redesigned data browser with database → collection → partition navigation and richer collection operations.
- Built-in Prometheus metrics, slow-query analysis, topology, and backup and restore.
- A REST API Playground for debugging and learning Milvus APIs.
- RBAC workflows that happen beside the database or collection, not only in a separate admin flow.
If you use Attu only for local Milvus development, 3.0 gives you a more capable console. If you manage several Milvus environments, the multi-cluster and persistent-state changes alone are worth trying. If you often debug performance or permission issues, the Agent, diagnostics, metrics, and in-context RBAC workflows should save time immediately.
Get Started
Try Attu 3.0 Beta with Docker:
docker run -d --name attu -p 3000:3000 -v attu-data:/data zilliz/attu:v3.0.0-beta.6
Then open:
http://localhost:3000
Add your Milvus connection from the sidebar and start exploring the new console.
Prefer a desktop app? Download the build for your platform from GitHub Releases. Attu 3.0 Beta provides desktop packages for macOS, Linux, and Windows. Recent releases also include a standalone Linux server package for running Attu without Docker or Electron.
Have questions? Bring your multi-cluster setup, custom agent skills, or diagnostic scenario to the Milvus Discord, or book Milvus Office Hours to work through it with the community.
Don’t want to operate Milvus infrastructure yourself? Zilliz Cloud is the fully managed platform from the creators of Milvus. It keeps the Milvus API and adds managed infrastructure for real-time vector search, large-scale discovery, and AI data operations. For teams with data-sovereignty requirements, Zilliz Cloud BYOC runs inside your own cloud account so data stays in your VPC while Zilliz handles operations.
- What Changed in Attu 3.0 Beta
- Manage Multiple Milvus Clusters From One Sidebar
- Local State Now Survives Restarts
- Use the Built-in AI Agent to Operate Milvus in Natural Language
- Run Expert Diagnostic Skills From the Console
- Bring Your Own LLM Provider
- Browse Milvus Data With a Database → Collection → Partition Tree
- Check Operations, Metrics, Slow Queries, Topology, and Backups in One Place
- Debug Milvus REST APIs With the Built-in API Playground
- Manage RBAC Beside the Database or Collection
- What This Beta Means for Attu Users
- Get Started
On This Page
Try Managed Milvus for Free
Zilliz Cloud is hassle-free, powered by Milvus and 10x faster.
Get Started


Like the article? Spread the word